Over the years, we’ve seen SERP features grow in diversity and number, push traditional organic results further and further down the page, and rake in those coveted clicks. And while you’ve always been able to get a glimpse of these SEO darlings in STAT, this is the first time we’re shining a dashboard-sized spotlight on ’em.
In our swanky new SERP Features tab, you’ll get feature insights from every angle possible — whether it’s the type of SERP features appearing for your keywords, the number of keywords producing those features, the share of voice being generated from them, or what, in all of that, you own.
We also took this opportunity to expand our share of voice metrics for a deeper understanding of the impact SERP features have. In STAT, share of voice is an estimated measure of search engine visibility and, in this case, we’re using it to measure how many eyeballs (or potential traffic-driving clicks), a SERP feature has.
Now let’s take you through the tab!
Share of Voice: SERP Features
The top panel of the tab is for quick insights and instant health-checks, and it sets the scene for deeper SERP feature exploration. Every module is powered by share of voice and updates with fresh data each day.
Since there are SERP features that you might care about more than others, you’re able to customize the ones you want appearing in the Top Increases/Decreases, Your Primary Source of SoV, and Your Top Gains/Losses modules. Just head to the Settings gear in the top right corner and start selecting.
Overview
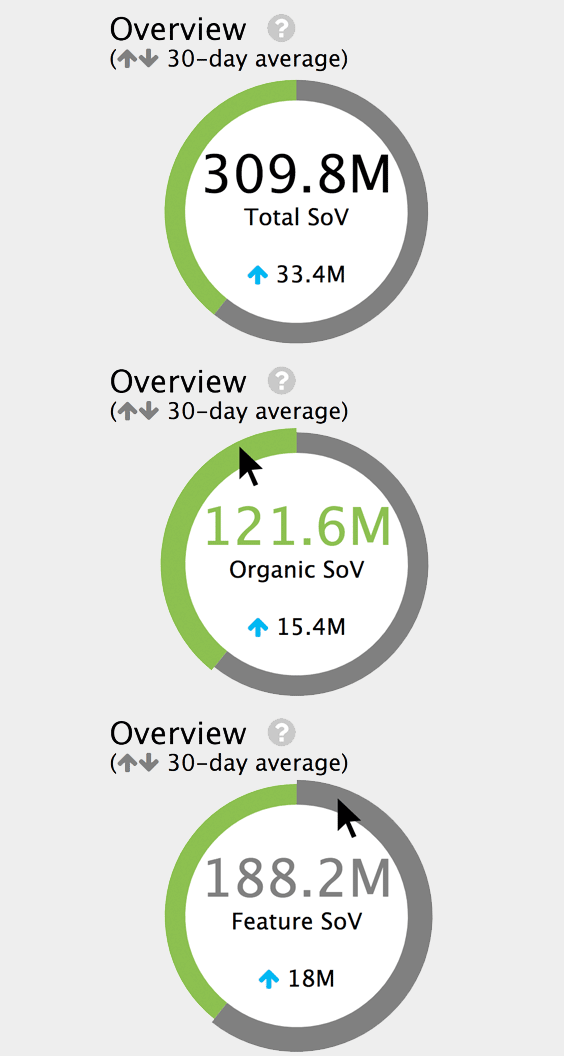
The first number you’re hit with in the Overview module is the total share of voice generated by your keyword segment that day. Directly below, you’ll see how much this amount has changed from the 30-day average. A blue arrow means your segment has extended its reach, and a red arrow means it’s lost some of its leverage.
The doughnut chart shows how this total is split between organic results and SERP features. Hover over the green section and you’re greeted with organic share of voice metrics; hover over the grey section and say hello to the share of voice that SERP features are responsible for.
When clicking through your sites, tags, and data views, this module will flag segments that might be good candidates for a SERP feature strategy. Start your investigation with segments that drive an unusually high SERP feature share of voice.
Top Increases/Decreases
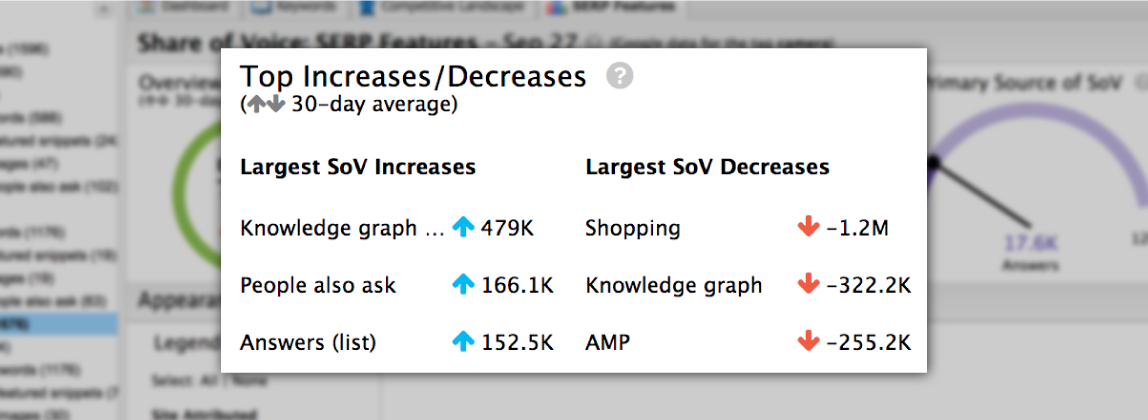
Come here for a peek at the general happenings of features on your SERPs.
This module shows you the three features that had the largest increases and decreases in share of voice. The metric for each feature gives the difference between the current-day total and the 30-day average, and the little blue and red arrows tell you whether it’s trending up or spiralling down.
Keeping an eye on rising SERP superstars is peanuts — if you’re always seeing huge gains in a particular feature, it’s probably worth an inquiry.
Your Primary Source of SoV
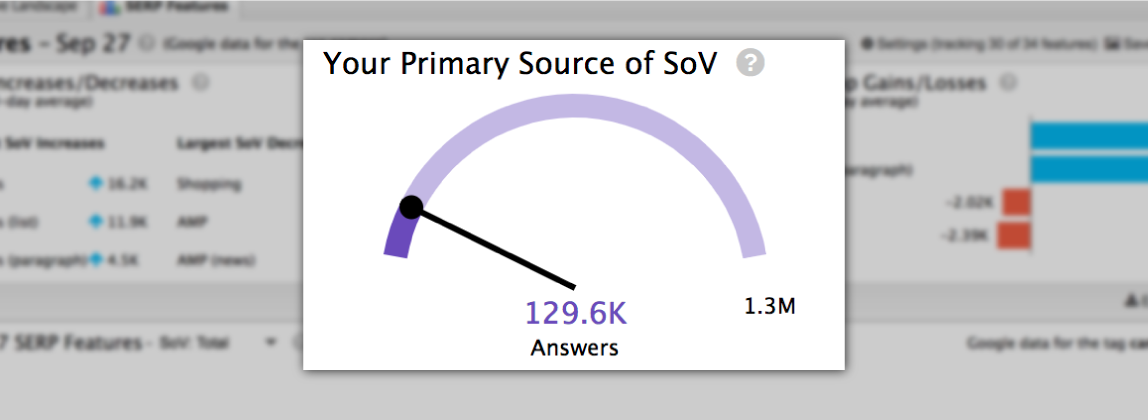
Here you’ll see the cream of your SERP feature crop. Out of all the features that you appear in, this one is giving your site the most visibility.
The speedometer shows the total share of voice available for the feature, and the needle marks how much you actually lay claim to — watch it move up and over as you hit your feature goals.
Your Top Gains/Losses
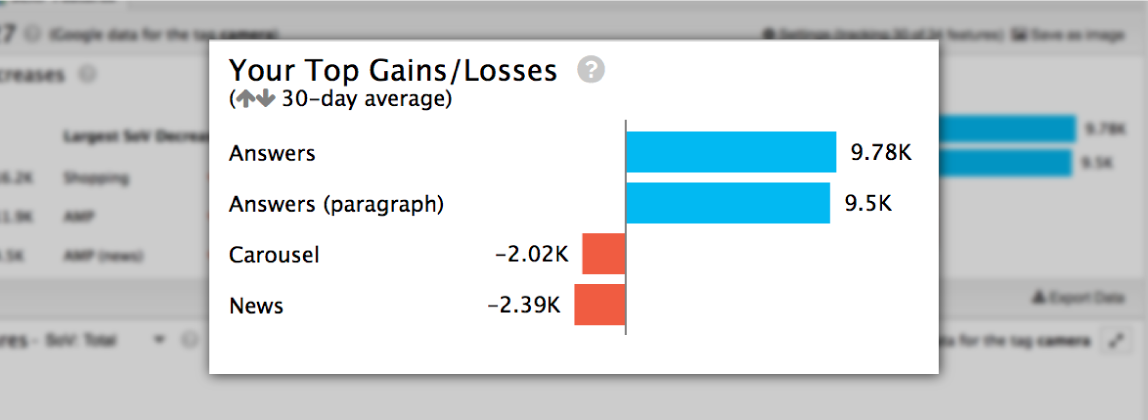
This module shows your biggest movers and shakers, for better and worse.
Out of all the features that you own, you’ll see the two whose visibility on the SERP has expanded and shrunk the most. The metric at the end of each bar is exactly how much daily share of voice has been gained (in blue) or lost (in red) when compared with the 30-day average. (Keep in mind here that the SERP feature giving you the biggest bang for your buck in the previous chart may not be making any gains.)
Use this intel in conjunction with the Top Increases/Decrease module to see how your ownership might be affected by the overall moods of the SERP — are you falling in line or bucking trends and gaining ground against all odds?
Appearance and Ownership
This section of the tab allows you to dig deeper into each feature that appears on your SERPs, as well as what your slice of its pie may be.
Use the teeny-tiny toggle button at the top-right corner of both charts to flip between a standard and full-screen size. Bigger views, better insights.
Legend
Not your ordinary legend, this one will populate with only the features that appear on your SERPs. If you don’t see a feature, neither did your SERPs.
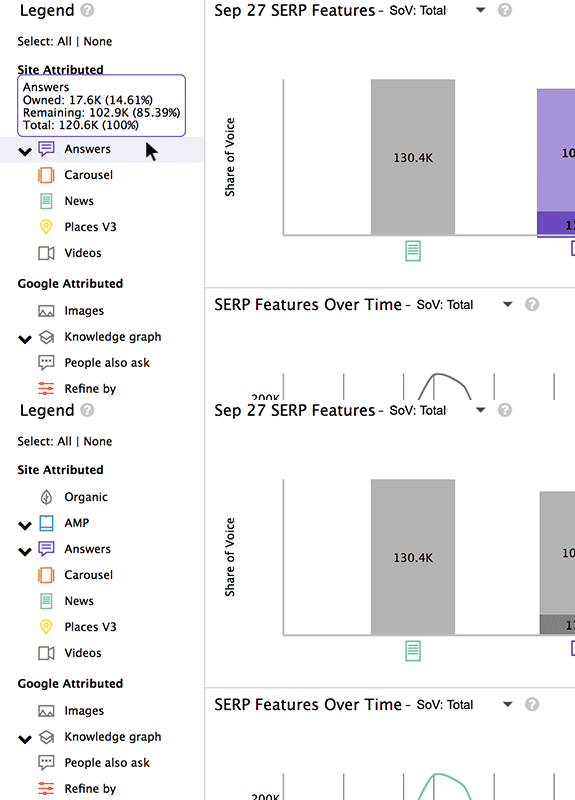
Along with giving you the features on your SERPs, the legend also controls the features you want to examine on the [Current Day] SERP Features and SERP Features Over Time charts — just click to add or remove them from view.
Don’t want a feature cluttering up your charts but still need the deets? Hover over it and a pop up will reveal to you the total, owned, and remaining values for share of voice or keyword count.
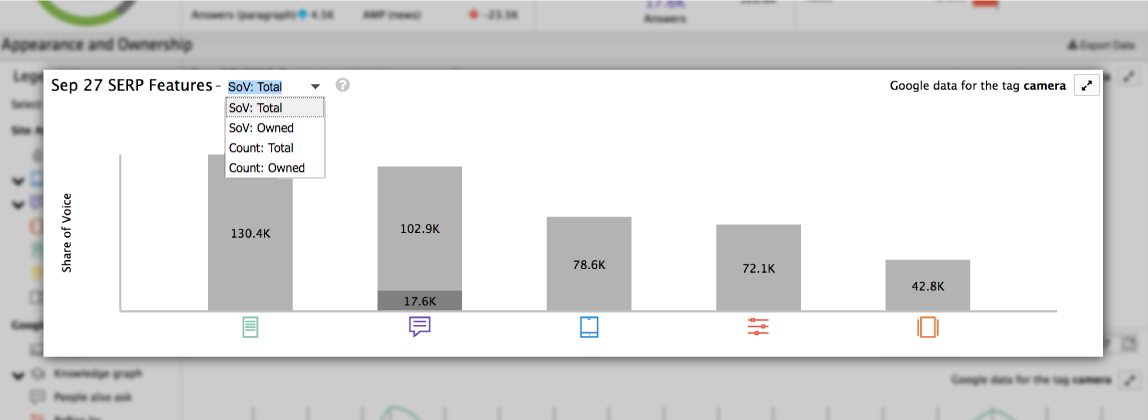
[Current Day] SERP Features
This chart gives you a daily snapshot of the SERP features appearing for your keywords.
Using the dropdown menu, you can view each feature in terms of the share of voice it drives or the number of keywords it appears on:
- SoV: Total — The total share of voice generated by a SERP feature.
- SoV: Owned — The amount of share of voice that you own.
- Count: Total — The total number of keywords that produced a SERP feature.
- Count: Owned — The number of keywords that produced a SERP feature that you own.
Why would you need to see both metrics? Because they’re two halves of a whole story — share of voice shows which feature can give your site the most amount of reach, and count lets you know how many keywords it’s going to take to make that happen.
Also, flipping between the two can help uncover blind spots — you might just find that you’ve been neglecting a small group of keywords that drive a huge amount of share of voice.
SERP Features Over Time
This chart does everything the one above does, but then takes those daily snapshots and plots them over time. Use the date-pickers in the top right corner to look back through your SERP feature history and learn what, when, and why things were (or weren’t) working.
Get your insights and data to go
Like what you see and want to share it around town (or with colleagues, clients, and higher-ups)? Simply click the Save as image button at the top right of the tab, and you’ll have a PNG image of your SERP feature insights in no time.
And, if you want to get your paws on all the juicy data found in the [Current Day] SERP Features and SERP Features Over Time charts, click the Export data button found on the Appearance and Ownership panel. Boom.
Learn even more
Keen for more info about this fancy new tab? Join our very own Rob Bucci and Deneece Berg as they take you on a live tour. Sign up for one of two special STATcast sessions — Wednesday, October 4 or Thursday, October 5 — to get in on all the action.
Want to explore a SERP feature strategy with the new tab? Learn how here on the blog.
Already been in the new tab and can’t wait to tell us about your time there? Share your story with us — email clientsuccess@getSTAT.com.
Cheers,
The STAT team


