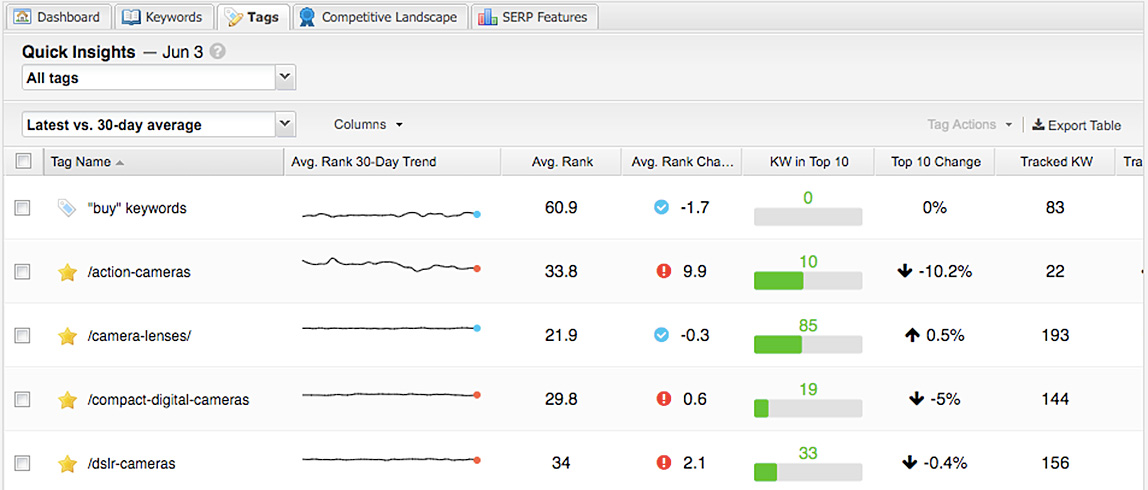
All the crucial information about your tags is finally in one place — the Tags tab! Now it’s easy as pie to see which keywords need your attention and how your segments stack up against each other.
If you remember a certain Tags section that once roosted under Site Tools, well, it got one heck of a UI facelift, loads new metrics (many of which you’ll recognize from the Dashboard tab), and transformed into the tab you see before you.
Here’s how to make the most of it.
Surface important tags lickety-split
Want to know which keyword segments are having the biggest impact, good or bad? Need to narrow down the playing field? Whatever the case, simply pick your favourite metrics and sort and filter to your heart’s content (just like you would in the Keywords tab) and all will be revealed.
Let’s say, for example, that keeping your keywords ranking in the top 10 is of the utmost importance. A click on the Top 10 Change header will sort the column’s contents by ascending order and bring your biggest losers to the top of the pile — i.e. the tags that dropped the most first-page ranks and need tackling tout de suite.
Or, maybe you’re on the hunt for tags that can give you a quick win and average rank is your North star. Filter the Avg. Rank column for averages between 10 and 20 and you’ll see segments with low-hanging, page-two fruit just waiting to be nudged up the SERP.
Overwhelmed by all the possibilities or not sure where to start? Let one of our suggested Quick Insights do the heavy lifting. Created with your data needs in mind, they’ll sort, filter, and kick any non-relevant columns to the curb thanks to pre-set criteria. This will help you think less and load up on brain-expanding intel at the same time.
You can choose your SEO adventure at random or come with a strategy in mind, like measuring the impact of site-wide changes. Select Best rank performance if you’re looking for tags that saw a boost, Worst rank performance for the ones that suffered some unintended consequences, and No change in rank performance for segments that refused to budge either way. Easy-peasy lemon squeezy.
Find the full list of Quick Insights and learn what they do here.
Group tags and compare performance
Of course, sometimes you’re not just interested in any ol’ tag that’s up to no good — you’re also interested in the relationship between specific tags because of their device, tracked location, or topic.
Think about your local SEO efforts — comparing non-geo-modified keywords against their geo-modified counterparts or different cities in the same state. And don’t forget about all that A/B testing you have to do — hello, landing pages. Thanks to side-by-side metrics in the Tags tab, all of that is a snap.
Take our local SEO example for instance. After bagging, tagging, and tracking our keywords accordingly, we can hop into the Tags tab, sort our segments by average rank, and see instantly what’s good: our geo-modified and sunny San Francisco keywords are ahead of the pack. With that in mind, we can decide if we want to expand our geo-modified keyword selection, whip our non-geo-modified segments into shape, or re-up our Los Angeles pages.
Running with the A/B testing option, first we set up dynamic tags that will pull in any keyword that ranks for our two landing pages — /cars-for-sale/ and /car-dealers/ respectively. Then we optimize the bejesus out of the former and leave the latter to fend for itself.
When that’s out of the way, the Tags tab can give us quick validation as to whether our efforts have paid off. And lo! Our optimized segment managed a higher average rank and better proportion of keywords in the top 10 than our control tag.
In order to set yourself up for comparison success, careful keyword segmentation is essential, choosing the right kind of tag is key, and data views are a must-have. Brush up on how to tag keywords as standard here or dynamic here and how to divvy them up into data views here.
Customize and export
Since we know you love customizing your data about as much as you love having data in the first place, there is opportunity galore in the Tags tab to get your personalization on.
For starters, the Columns dropdown lets you pick and choose which metrics you want displayed. And if it’s movement you’re after, you can adjust the date range those averages compare against. Use the dropdown beneath the Quick Insights section to see the change between your current and 7-, 14-, 30-, or 60-day averages.
Once you’ve got your table just right, then there’s all that sorting and filtering we talked about. And if a little house-keeping’s in order, head to Tag Actions to edit, delete, or toggle tracking on or off.
When you like what you see, get those metrics to go via the Export Table button. Badda bing, badda boom.
Exploration starts in the Tags tab
So what are you waiting for!
Already been in the new tab and can’t wait to tell us about your time there? Share your story with us — email clientsuccess@getSTAT.com. If you’ve got questions, don’t hesitate to pass those along, either.
Happy tagging,
The STAT team


