Segmenting your data is key to getting the best insights out of STAT. If you’ve spent time grouping your data and creating tags you’ll want to know the best report to pull in order to see how those segments are performing. Follow the steps below to create a Dynamic Tag In/Out report.
“I’ve created dynamic tags based on URL filters. How can I see which keywords have dropped in or out of one of these dynamic tags?”
1. Log in to STAT and open the project you want to work on from the Projects pane.
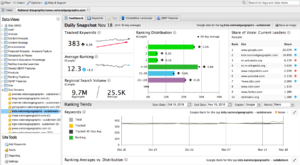
2. Select one of your dynamic tags. Take a look at the Tracked Keywords graph on the Dashboard tab to see if there has been an increase or decrease.
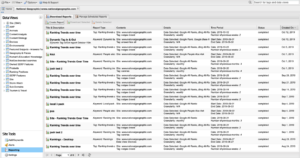
3. Under Site Tools, select Reporting. Next, in the Download Reports tab click on the Create Report button to get started.
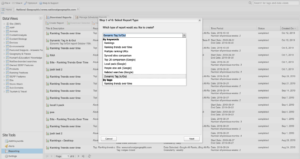
4. Choose the report type by clicking on the drop down menu. Select Dynamic Tag In/Out and click Next.
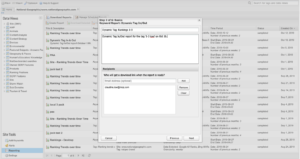
5. Create a name for your report and optional description. Add the email address of the report recipient and click Next.
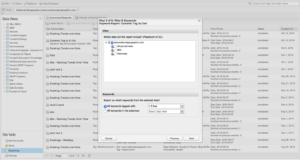
6. Check the box for the site you want to generate a report for. Below, depending on whether you want to report on specific tags or data views, select the corresponding option and select your chosen tags or data views accordingly. Click Next.
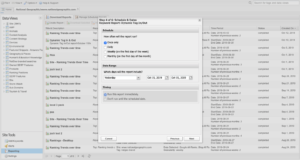
7. Select the option that corresponds with when you want your report to run and fill in the date range fields. Click Next.
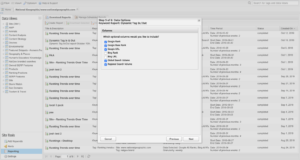
8. Choose the optional columns you’d like to see in your report. Click Next.
9. Check all the report details are correct before clicking Finish.

