Content optimization campaigns are among the most common type of strategies we help our customers with.
Follow the steps below to segment those all important keywords and build data views, so you can quickly start tracking category performance in STAT.
“I’m an e-commerce client, with a focus on different lines of swimwear. I want to see how my different swimwear categories perform. How should I set this up in STAT?”
1. Log in to STAT and open the project you want to work on from the Projects pane.
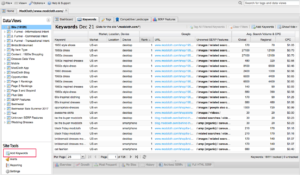
2. Click on Add Keywords under Site Tools.
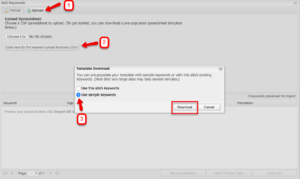
3. The Add Keywords pop-up will appear, with the Upload tab open. Select the Click here for the keyword upload template (CSV) button.
4. Choose the sample keyword option and download the template.
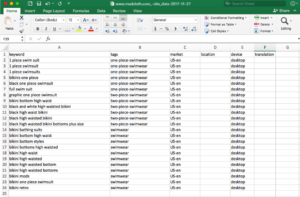
5. Open the spreadsheet and fill it with your chosen keywords and tags.
6. When you’re finished in the spreadsheet, save the file locally and return to the Upload tab in STAT.
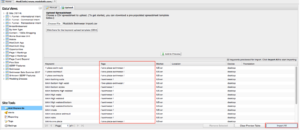
7. Click Choose file, select the saved file and then click Add to Preview. You should see your keywords and tags populate under the column headers.
8. Check the preview to make sure that everything is correct, and then click Import All.
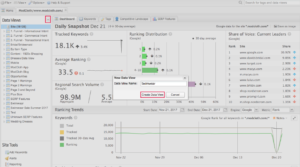
9. Create a new data view by clicking on the |+| button in the Data Views pane. Type in a name for your new view, then click Create Data View.
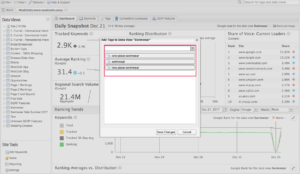
10. Find your new data view in the Data Views pane and right-click on it. Select Add Tags to View from the pop-up menu.
11. Choose the tags you want to add to the data view and click Save Changes.
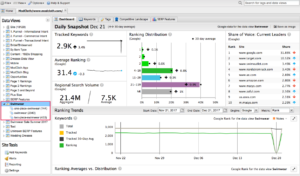
12. Finally, you should see that those swimwear tags grouped together in a new data view.
Take your segments one step further; STAT can help you identify instances where your ideal landing page is ranking for your different keyword categories.
Take a look at the dynamic segments workflow.

