If your average keyword ranking has seen a major gain or drop, use this workflow to investigate which keywords are driving the change.
“I want to investigate a major rank fluctuation in my keywords.”
Step 1: Identify when the average ranking change happened
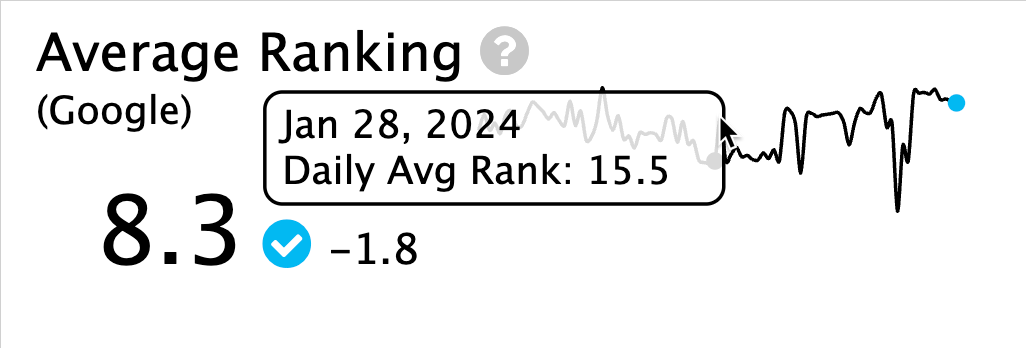
Go to the Dashboard tab and check the Average Ranking sparkline. This shows the three-month trend for the average Google rank for all keywords for the view you’re currently in. Hover over the line to see the date and average rank data, and identify when any large gains or drops in ranking occurred.
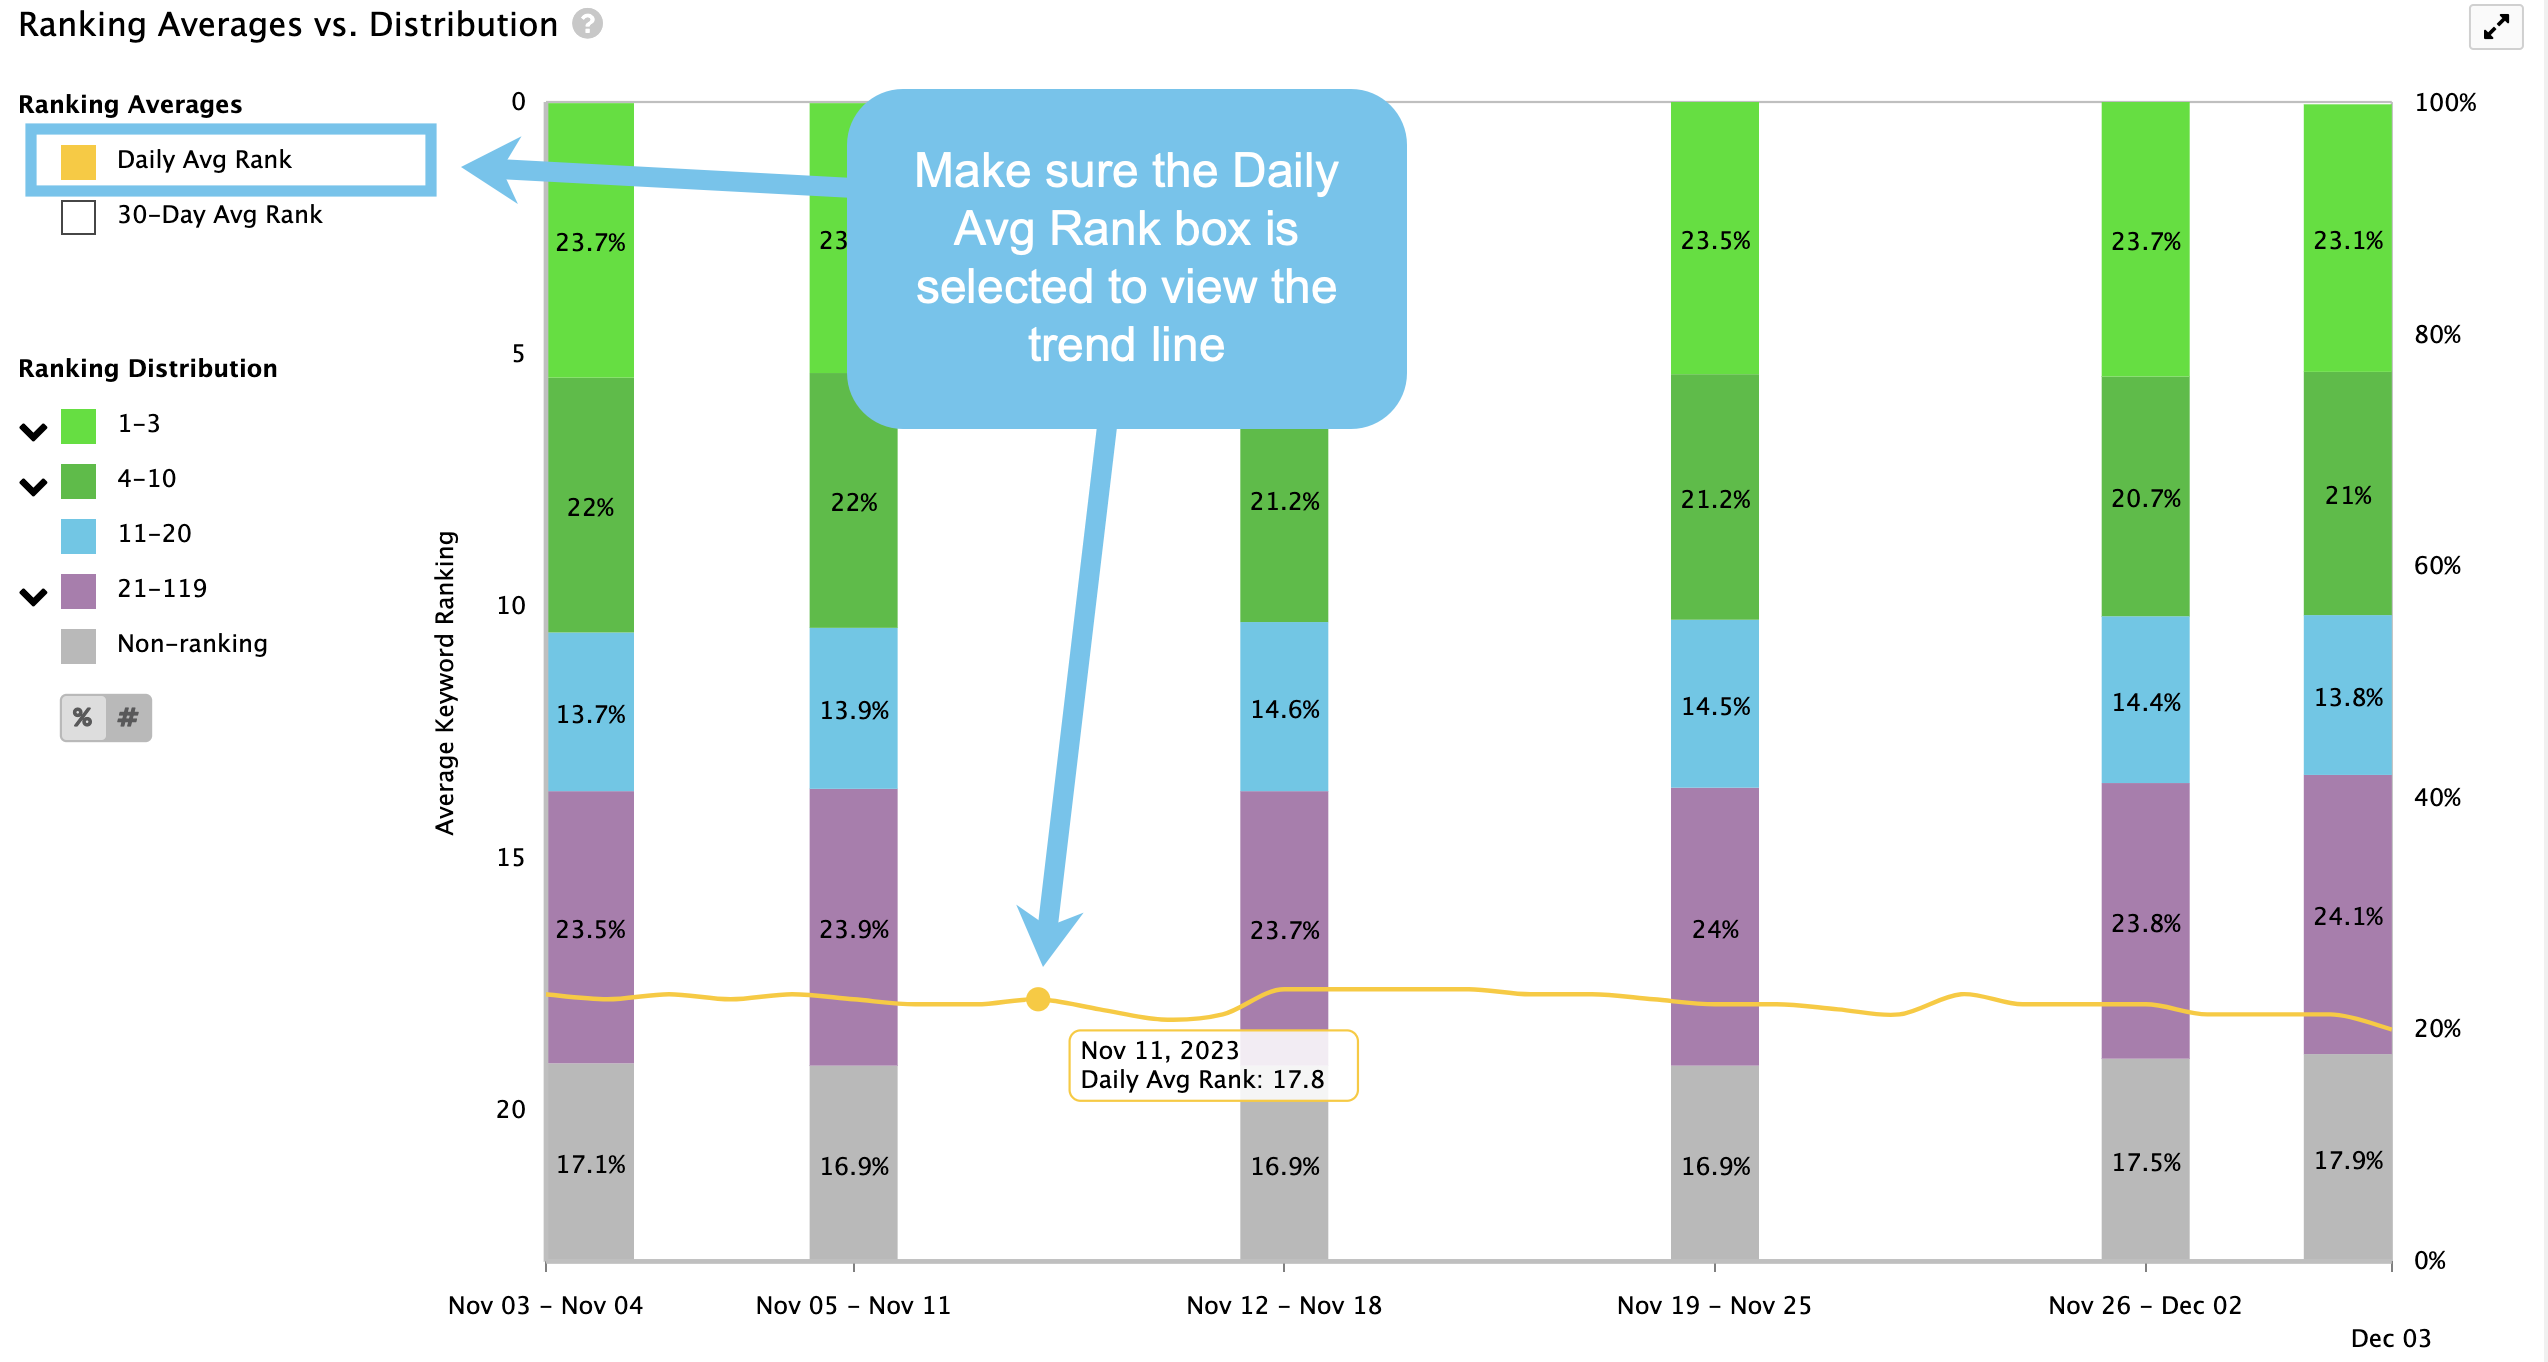
You can also check a longer average rank window on the Ranking Averages vs Distribution chart at the bottom of the Dashboard tab. First select the date range you wish to investigate using the date pickers at the top right of the Ranking Trends module. Make sure the Daily Avg Rank line box has been selected to view the trend line on the Ranking Averages vs Distribution chart.
Step 2: Pinpoint the specific keywords that caused the change
From the Keywords tab you can investigate which specific keywords have risen or dropped the most. Ensure that the Custom Ranking Change column is displayed. If you don’t see this column, click the Show/Hide button, then hover over Columns to select it.
Hover over Rank Change Dates from the drop-down menu in the column header and select the time period when the ranking change occurred.
Sort Ascending to see the keywords with the largest gains in ranking; Sort Descending to see the largest drops.
You can add to your rank comparison insights by discovering how SERP features and URLs changed between your two chosen dates. Create a Rank Comparison report (CSV) from the Keywords table by right-clicking on a keyword, selecting Rank Comparison then your date range. Export the rank comparison information for the entire site by clicking the Export Keyword Table button.
As well as using your downloaded report to see how SERP features and URLs changed, you can also isolate and identify any major gains or losses. To do this, apply a filter to the rank change column. For example, by filtering the column for numbers greater than 10 you’ll be able to see keywords that moved significantly up the rankings between your two selected dates. This is another way of identifying the keywords that caused a fluctuation.
Step 3: Track keyword segments to monitor ranking changes
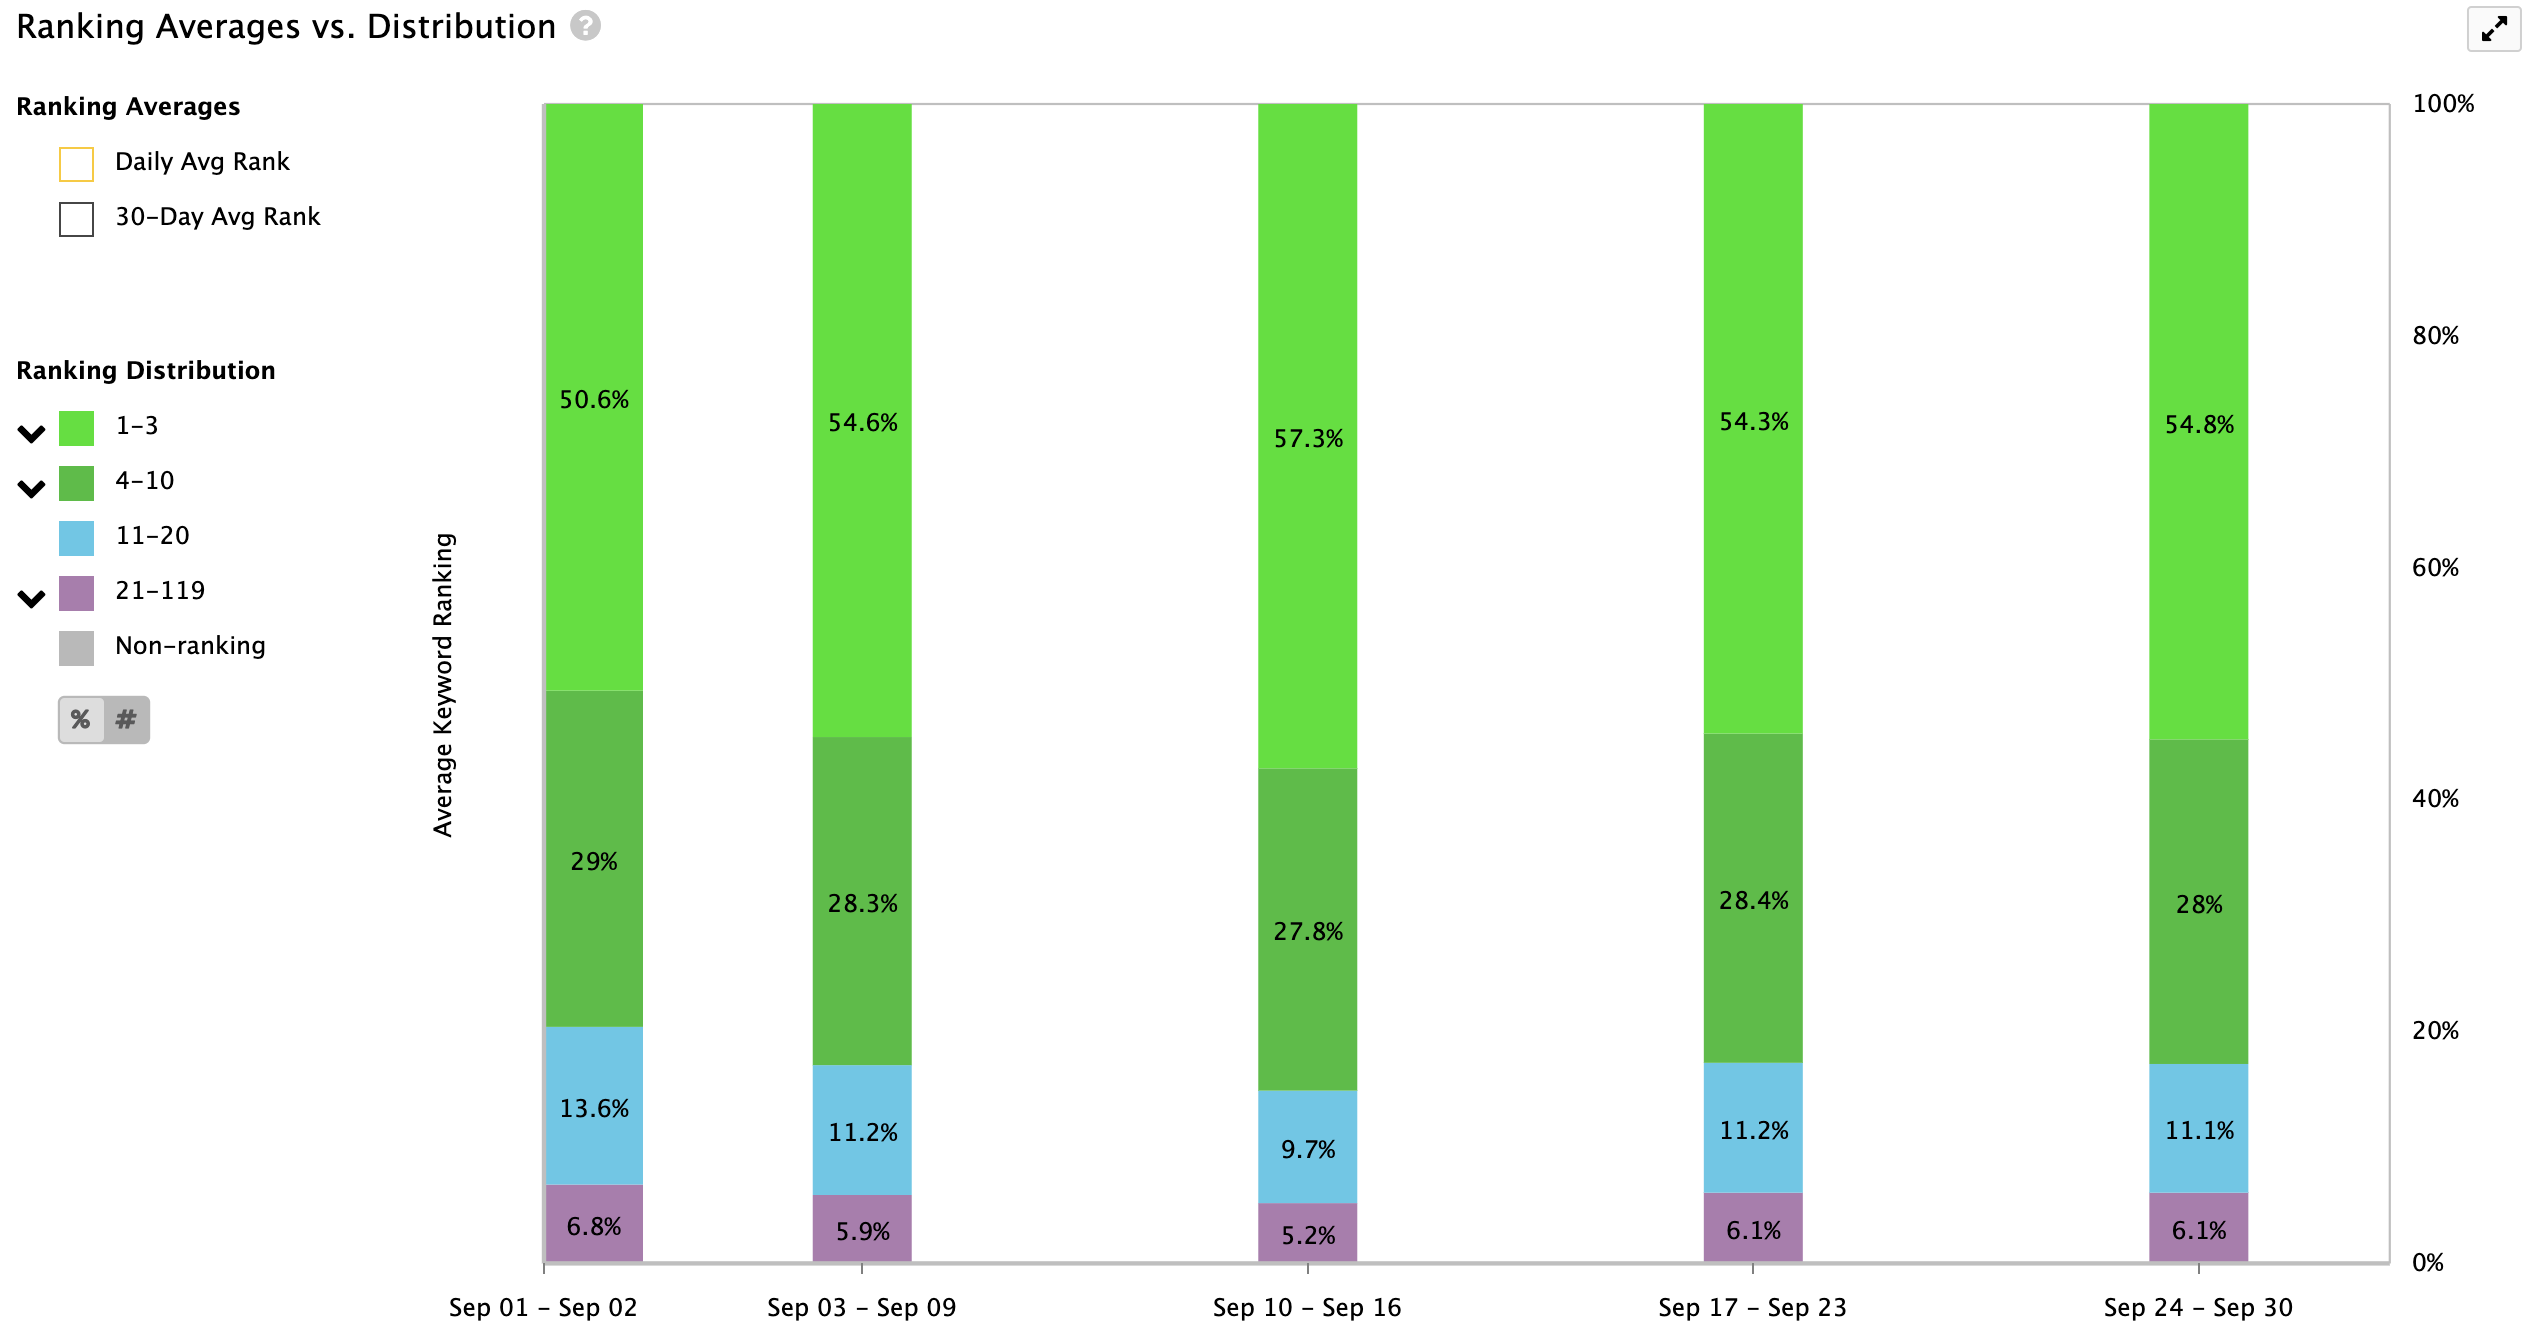
The Ranking Averages vs. Distribution chart groups your keywords by ranking position. From the Dashboard, scroll down to the chart to see which ranking groups are changing the most. For example, positions 1-3 might have seen an increase in keywords from 50% to 54% which would be an indicator of a data point worth investigating further.
If you haven’t already done so, now is a good time to set up a dynamic tag for the ranking group you wish to investigate. For example, you may wish to set up a dynamic tag for keywords ranking in positions 1-3, based on the increase identified on the Ranking Averages vs. Distribution chart.
To do this click on the Keywords tab and then the drop-down menu on the Rank column. Select Filter keywords, and filter by less than 4. The keywords table will now show keywords ranking in positions 1-3.
Tag those keywords by clicking on the Tag All Filtered Keywords button at the top of the table. In the pop-up window create a name for your new tag, for example “1-3 kws”, and make sure the tag type selected is Dynamic tag, based on your current filters. Click Save to create the tag. You’ll now see your new tag displayed in the Data Views pane.
Step 4: Gain further insights with Dynamic Tag In/Out and Top 20 Comparison reports
You now have two reporting options available to gain further insights into the keywords causing the ranking fluctuation.
Option 1: Run a Dynamic Tag In/Out report
Run a Dynamic Tag In/Out report on the dynamic tag you created earlier. This will allow you to investigate which specific keywords are flowing in and out of the ranking group.
To do this select Reporting under the Site Tools panel. Click on the Create Report button at the top of the reporting tab. A pop-up window will appear with six steps to complete. Click on Dynamic Tag In/Out from the drop-down menu of report types. Next, give your report a name and description, and add an email address if you want to receive the report as a download link. Step 3 requires you to select the sites to be included in the report, and the keywords. In the Keywords box choose All keywords tagged with and then select your new tag from the down-down list.
Next, choose how often you want the report to run and the date range you want to investigate. Step 5 allows you to pick which columns you want included in the report, and step 6 will summarize your report criteria. Click Finish when you’ve confirmed the report details, and the report will start downloading to the reporting tab. Open the report to analyze which specific keywords are moving in and out of the tag.
Option 2: Download a Top 20 Comparison report
Additionally, you can see how the top 20 rankings have changed between your two selected dates by running a Top 20 Comparison report. To do this follow the same initial steps as when you downloaded a Dynamic Tag In/Out report. Select Reporting under the Site Tools panel, click on the Create Report button at the top of the reporting tab and select Top 20 Comparison report from the drop-down menu. Follow the six steps to choose your reporting criteria and date range options.
Related resources:
Workflows


