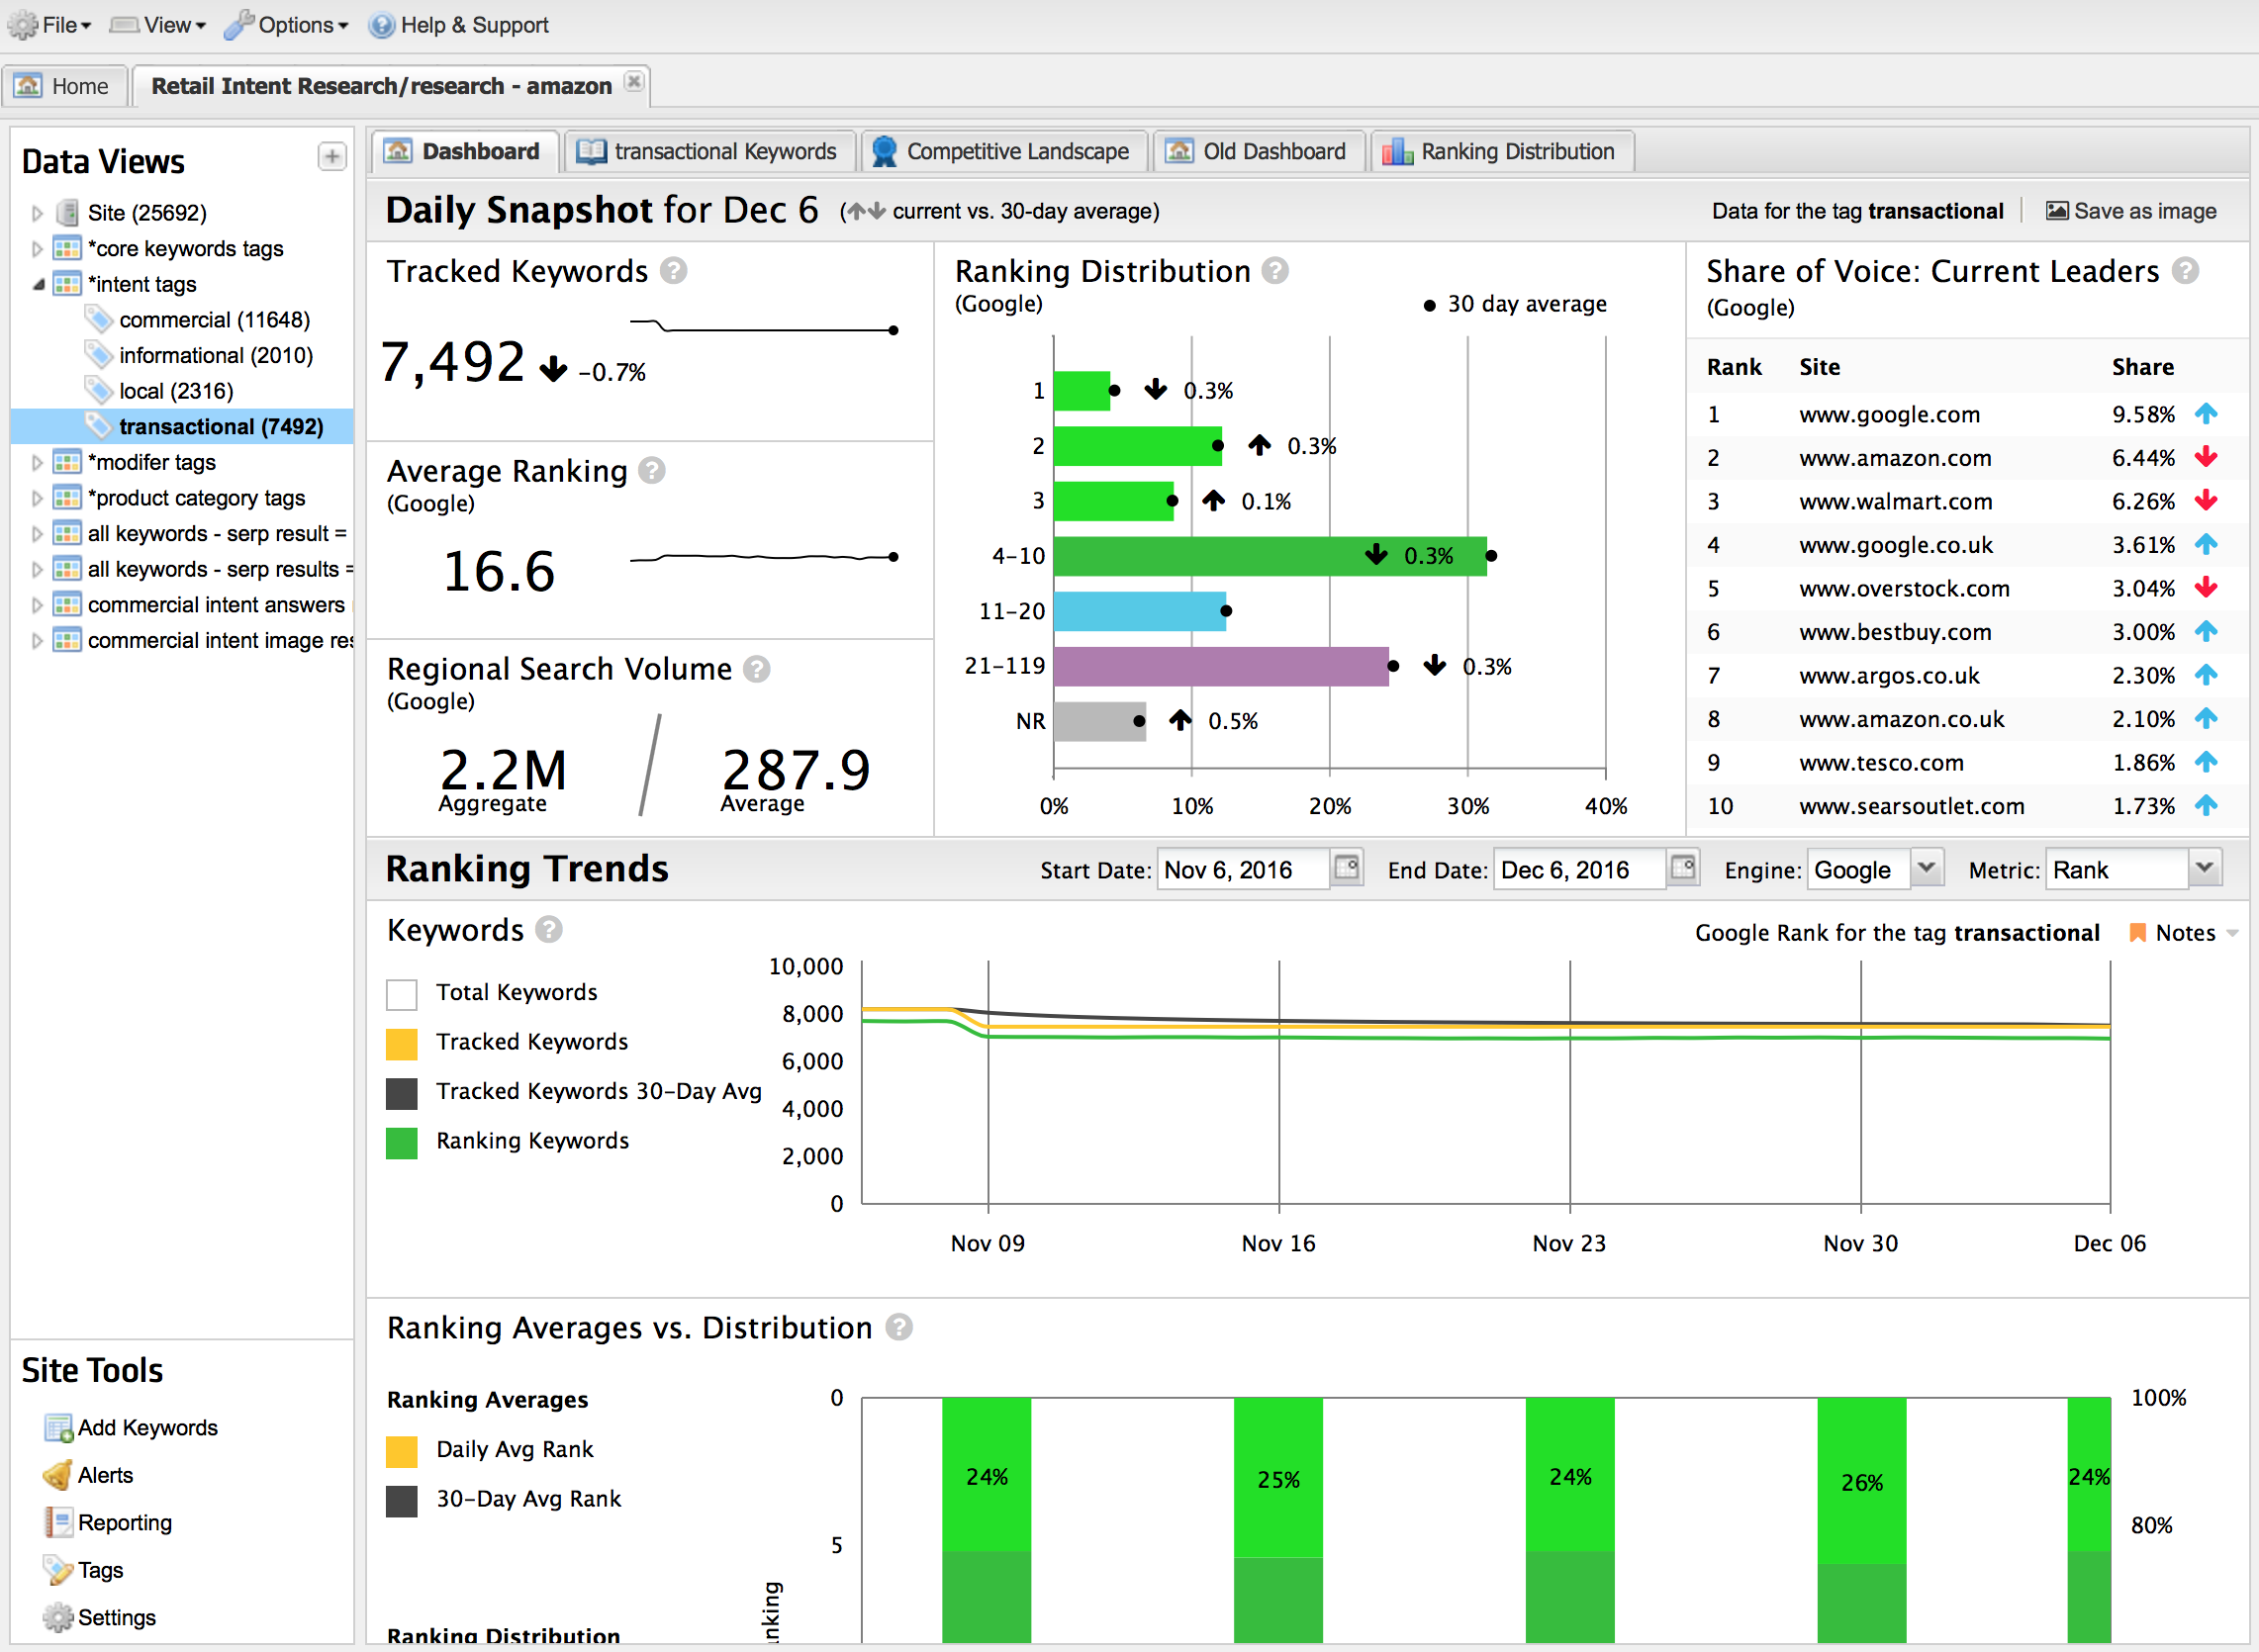
Today, STAT clients will unwrap a brand new dashboard, chock-full of segment-driven insights.
The existing dashboard that you’ve come to know will now be re-labeled Old Dashboard, and the new Dashboard tab will be your one-stop-shop for a clear, detailed view of your site, data view, and tag performance.
Many of the modules in the new dashboard will be familiar to well-seasoned STAT clients: things like ranking distributions, average rankings, and share of voice current leaders already existed in STAT, but are being rolled into this central location.
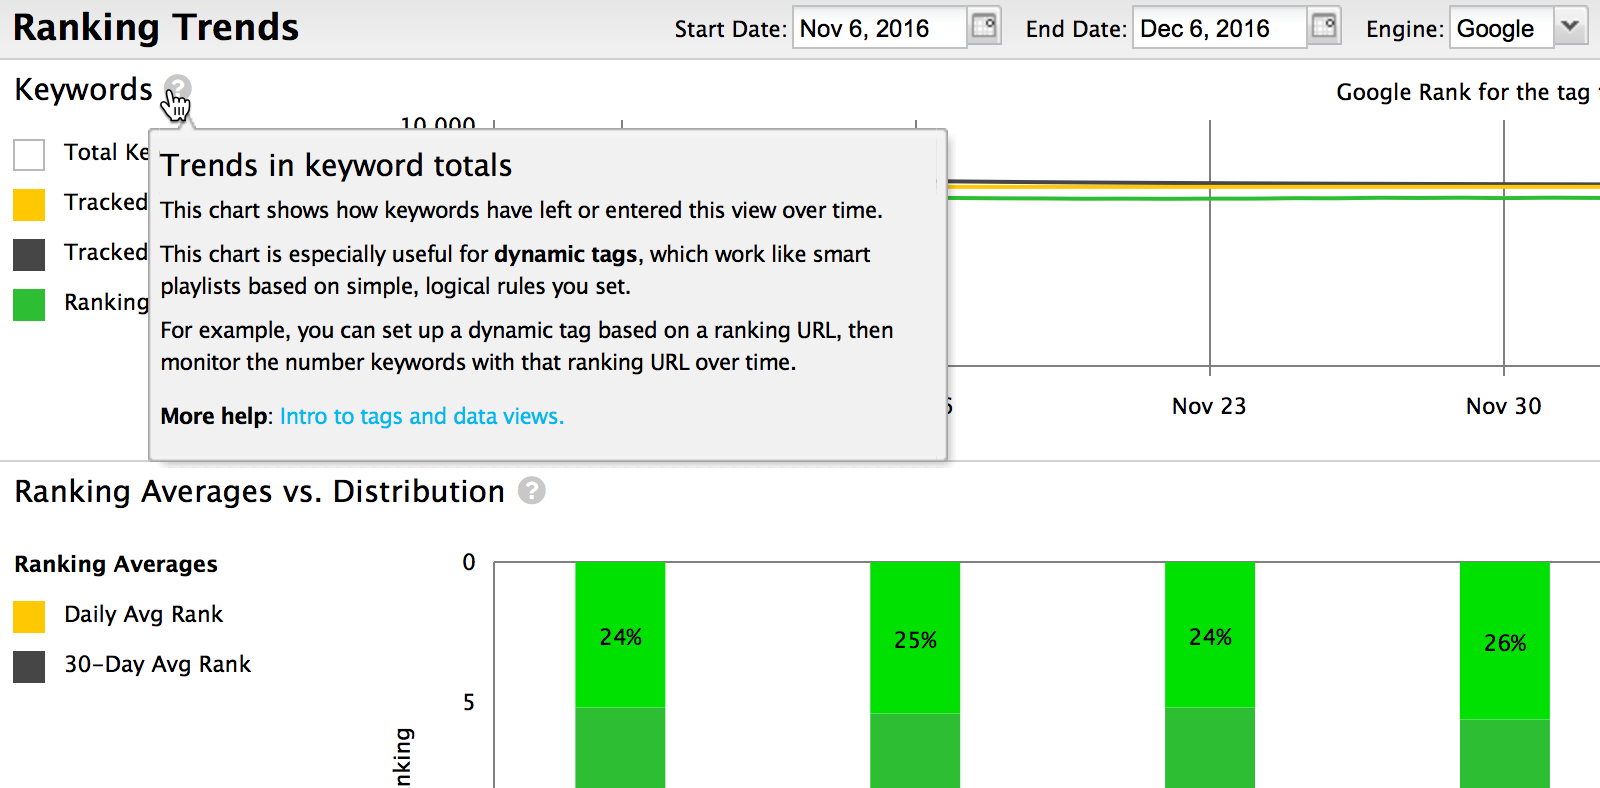
The new dashboard is a great place for n00bs to get familiar with the kind of data that can be uncovered in STAT. You’ll see little question marks in each module on the dashboard. Simply click these doo-dads and you’ll get a pop-up with a detailed description of the data we’re displaying, plus a link to the knowledge base for further reading.
Now let’s get into the nitty gritty. There are two main sections in the new dashboard: the Daily Snapshot and Ranking Trends.
Daily Snapshot
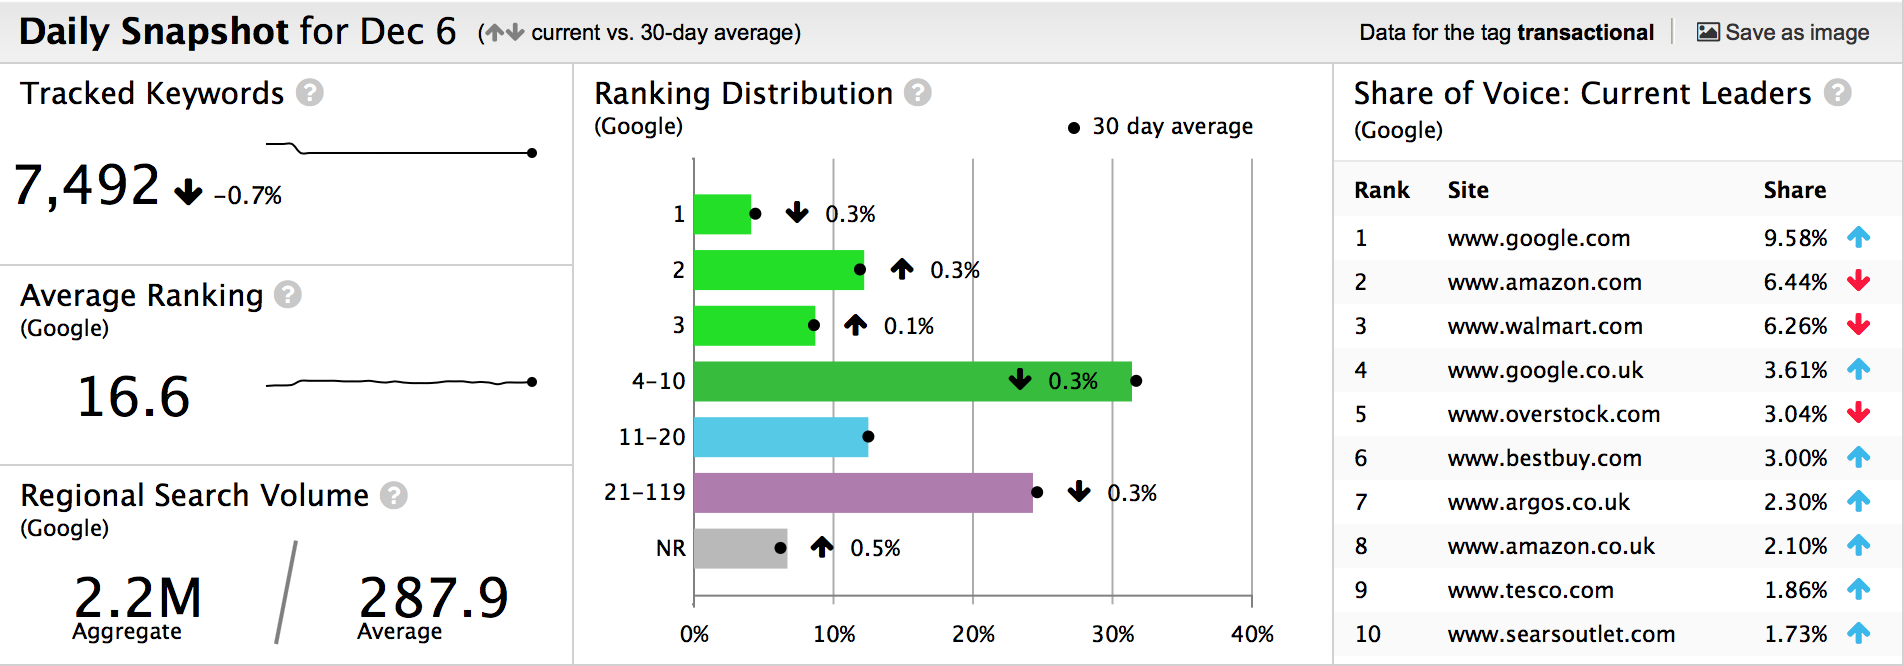
This section displays your tracked keywords, average ranking, regional search volume, ranking distribution, and share of voice current leaders. All of these metrics are fresh each day, and are compared against your full 30-day average.
In the left modules, you’ll see just how many keywords are in your selected segment, what the average ranking is — if it has gained or lost rank position — and the aggregate and average search volumes.
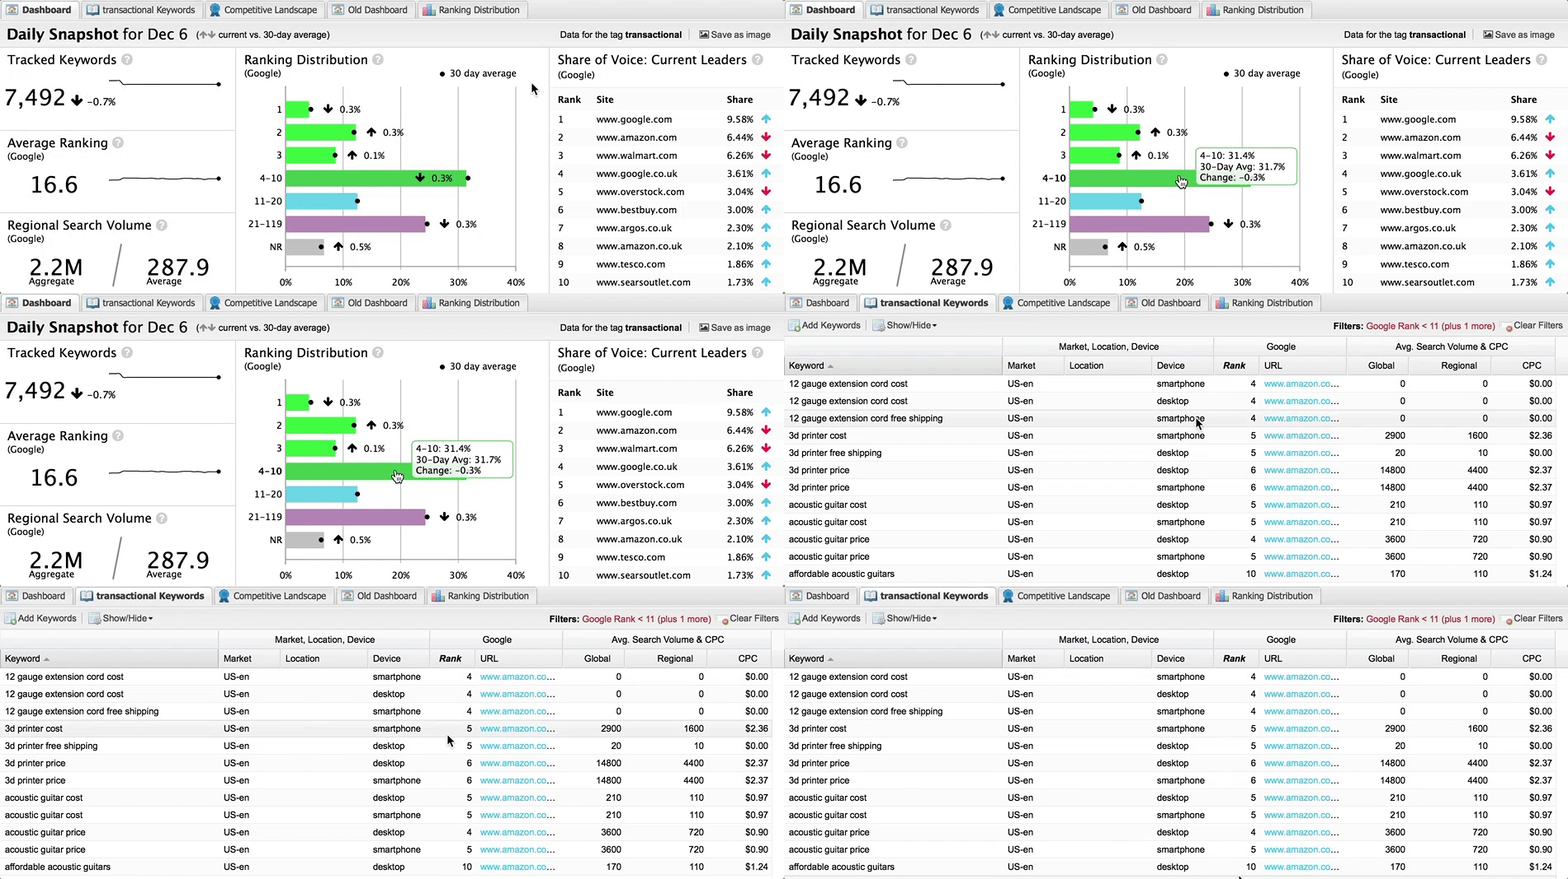
The middle module is one of the coolest parts of the dashboard. Here, just click on any bar in the Ranking Distribution chart and STAT will take you to the Keywords tab with the corresponding filtered view of the results! In the blink of an eye, see the list of keywords for each of your ranking positions.
In the right module, we’ve integrated the current share of voice leaders from the Competitive Landscape tab. The little red and blue arrows in the table provide a visual cue for who’s gaining and losing ground compared to 30 days ago, so keeping an eye on who’s dominating the SERPs for your keyword segments has become that much easier.
Ranking Trends
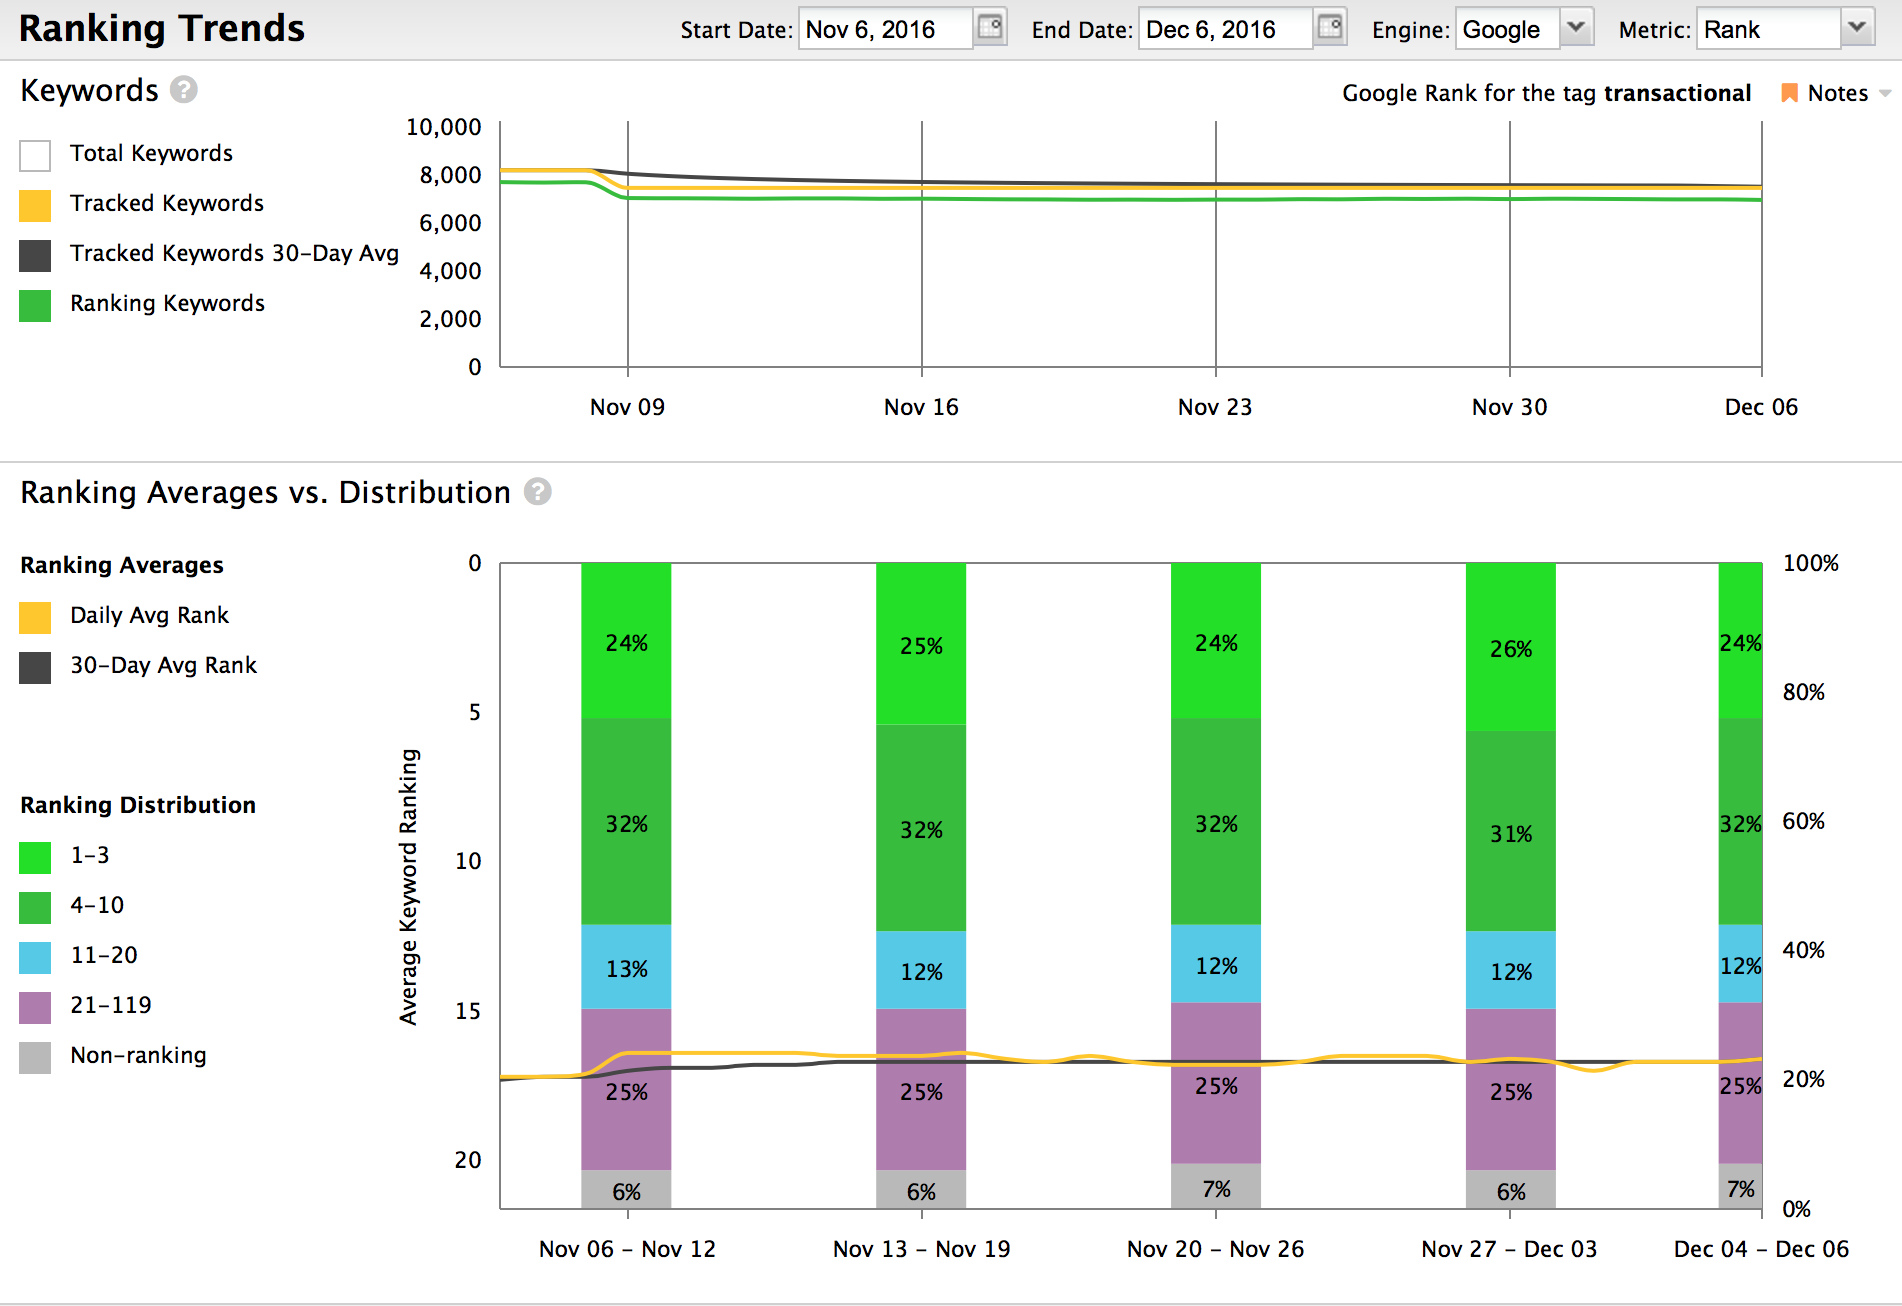
Ranking trends and distribution are not new to STAT, but up ‘til now they lived in different locations. We decided to pull them into this new, central dashboard so there’s no more clicking around to see your ranking keywords, average rankings, and ranking distributions. Just click on your site, data view, or tag and boom! Your segment-focused health check is there, in living colour.
You may also notice upon closer inspection of the Ranking Averages vs. Distribution chart, that (after popular demand) we’ve made the switch from absolute values to percentages. This should help absorb the shock from fluctuations that occur naturally when keywords are added or removed from segments.
Chart notes is another feature that’s not entirely new, but that we’ve made so much easier to discover and use. From the Keywords chart, you can make a quick note to remind you when Google unleashed an algorithm update or you added new keywords. System notes will appear automatically for things like data backfills and changes to site settings. Show or hide notes by clicking on the drop-down menu on the top-right.
If you happen to be looking for the Most Frequently in Top 10 chart, it’s been relocated to the Competitive Landscape tab.
Export and share with your friends (or clients!)
And finally, this entire, beautiful dashboard can be quickly exported as a PNG image and shared with clients, management teams, or anyone else who loves brightly coloured, insightful snapshots of easy-to-digest data.
All you have to do is click the Save as image button at the top right of the dashboard.
We’re retiring the old dashboard and Ranking Distribution tab on Feb 1, 2017
We’re going to keep the old dashboard and Ranking Distribution tabs kicking around until February 1, 2017, just to ease you into the new set-up. If you’re looking for more info, give the dashboard documentation a read-through. As always, we’re here for you if you have any questions or need any training. Just give your success coach a shout and they can show you how to get the most out of the new dashboard with your very own data.
Like every new feature at STAT we welcome your ideas or feedback to make the new dashboard even more useful. Let us know at Support@getSTAT.com.
Happy tracking,
Rob and the STAT crew.

