(Formerly known as Google Data Studio connectors)
Getting started
STAT’s collection of connectors will enable you to import STAT Google ranking data into Looker Studio, including all basic ranking and historical data. With site-level and tag-level connectors, you can send historical rankings, share of voice, and rankings distribution data for your STAT keywords — making it quick and easy to report on your keyword performance to any stakeholder.
Looking for more information on Looker Studio? Check out the following resources to learn more.
We have six connectors available. Add a connector to Looker Studio by clicking a link below to open the setup page.
- Site-level Historical Keyword Rankings Connector
- Tag-level Historical Keyword Rankings Connector
- Site-level Share of Voice Connector
- Tag-level Share of Voice Connector
- Site-level Ranking Distributions Connector
- Tag-level Ranking Distributions Connector
What can I learn on this page?
On this page you can find out about…
- Frequently Asked Questions
- How to set up a connector
- How a report Looker Studio will appear
- How to add fields to your Looker Studio report
- How to select date ranges and order the data in your report
- Example reports for site and tag connectors
- A list of all our connector outputs
- Reporting ranges of our connectors
- Limitations of the Looker Studio platform
Frequently Asked Questions
Error codes can sometimes be a cause of the wrong information being entered on the connector set up page. Check that you haven’t mistakenly entered your project ID into the STAT Site ID or STAT Tag ID field on the form. If you’re not already familiar with the API and are following the connector step-by-step instructions to find your site or tag ID you will first need to have your project ID.
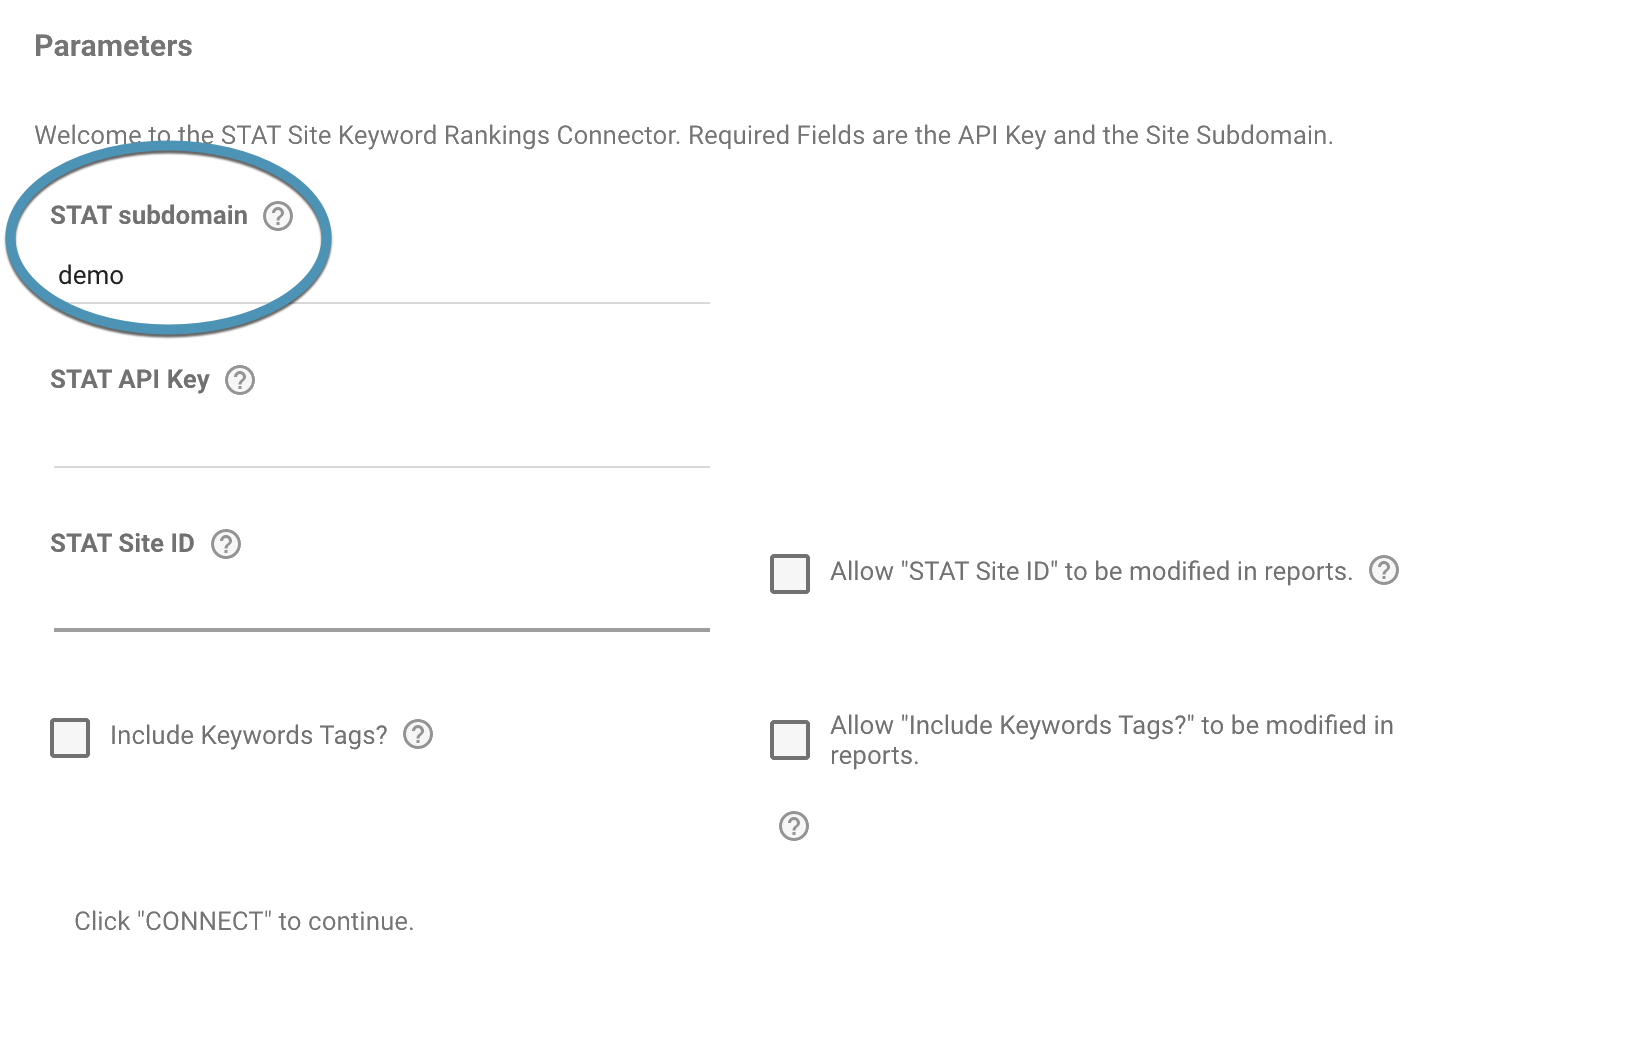
It’s important to correctly fill out the STAT subdomain field on the connector set up page. Use just the beginning of your STAT login URL to complete this field. For example, if your STAT login URL is demonstration.getstat.com then your STAT subdomain is demonstration.
Make sure that the chart date ranges only include days when the tag or site existed. You won’t be able to retrieve data from before a tag or site existed or when it was untracked.
By default Looker Studio recalculates averages based on the data that’s not being filtered out. For example, if you have a keyword that ranks in positions 9, 10 and 11 throughout a month, and you filter your data to exclude ranks greater than 10, the average rank for this keyword will appear to be lower than it actually is for that month. This happens because Looker Studio is removing all the worst ranks (11) based on your filter criteria and recalculating the average.
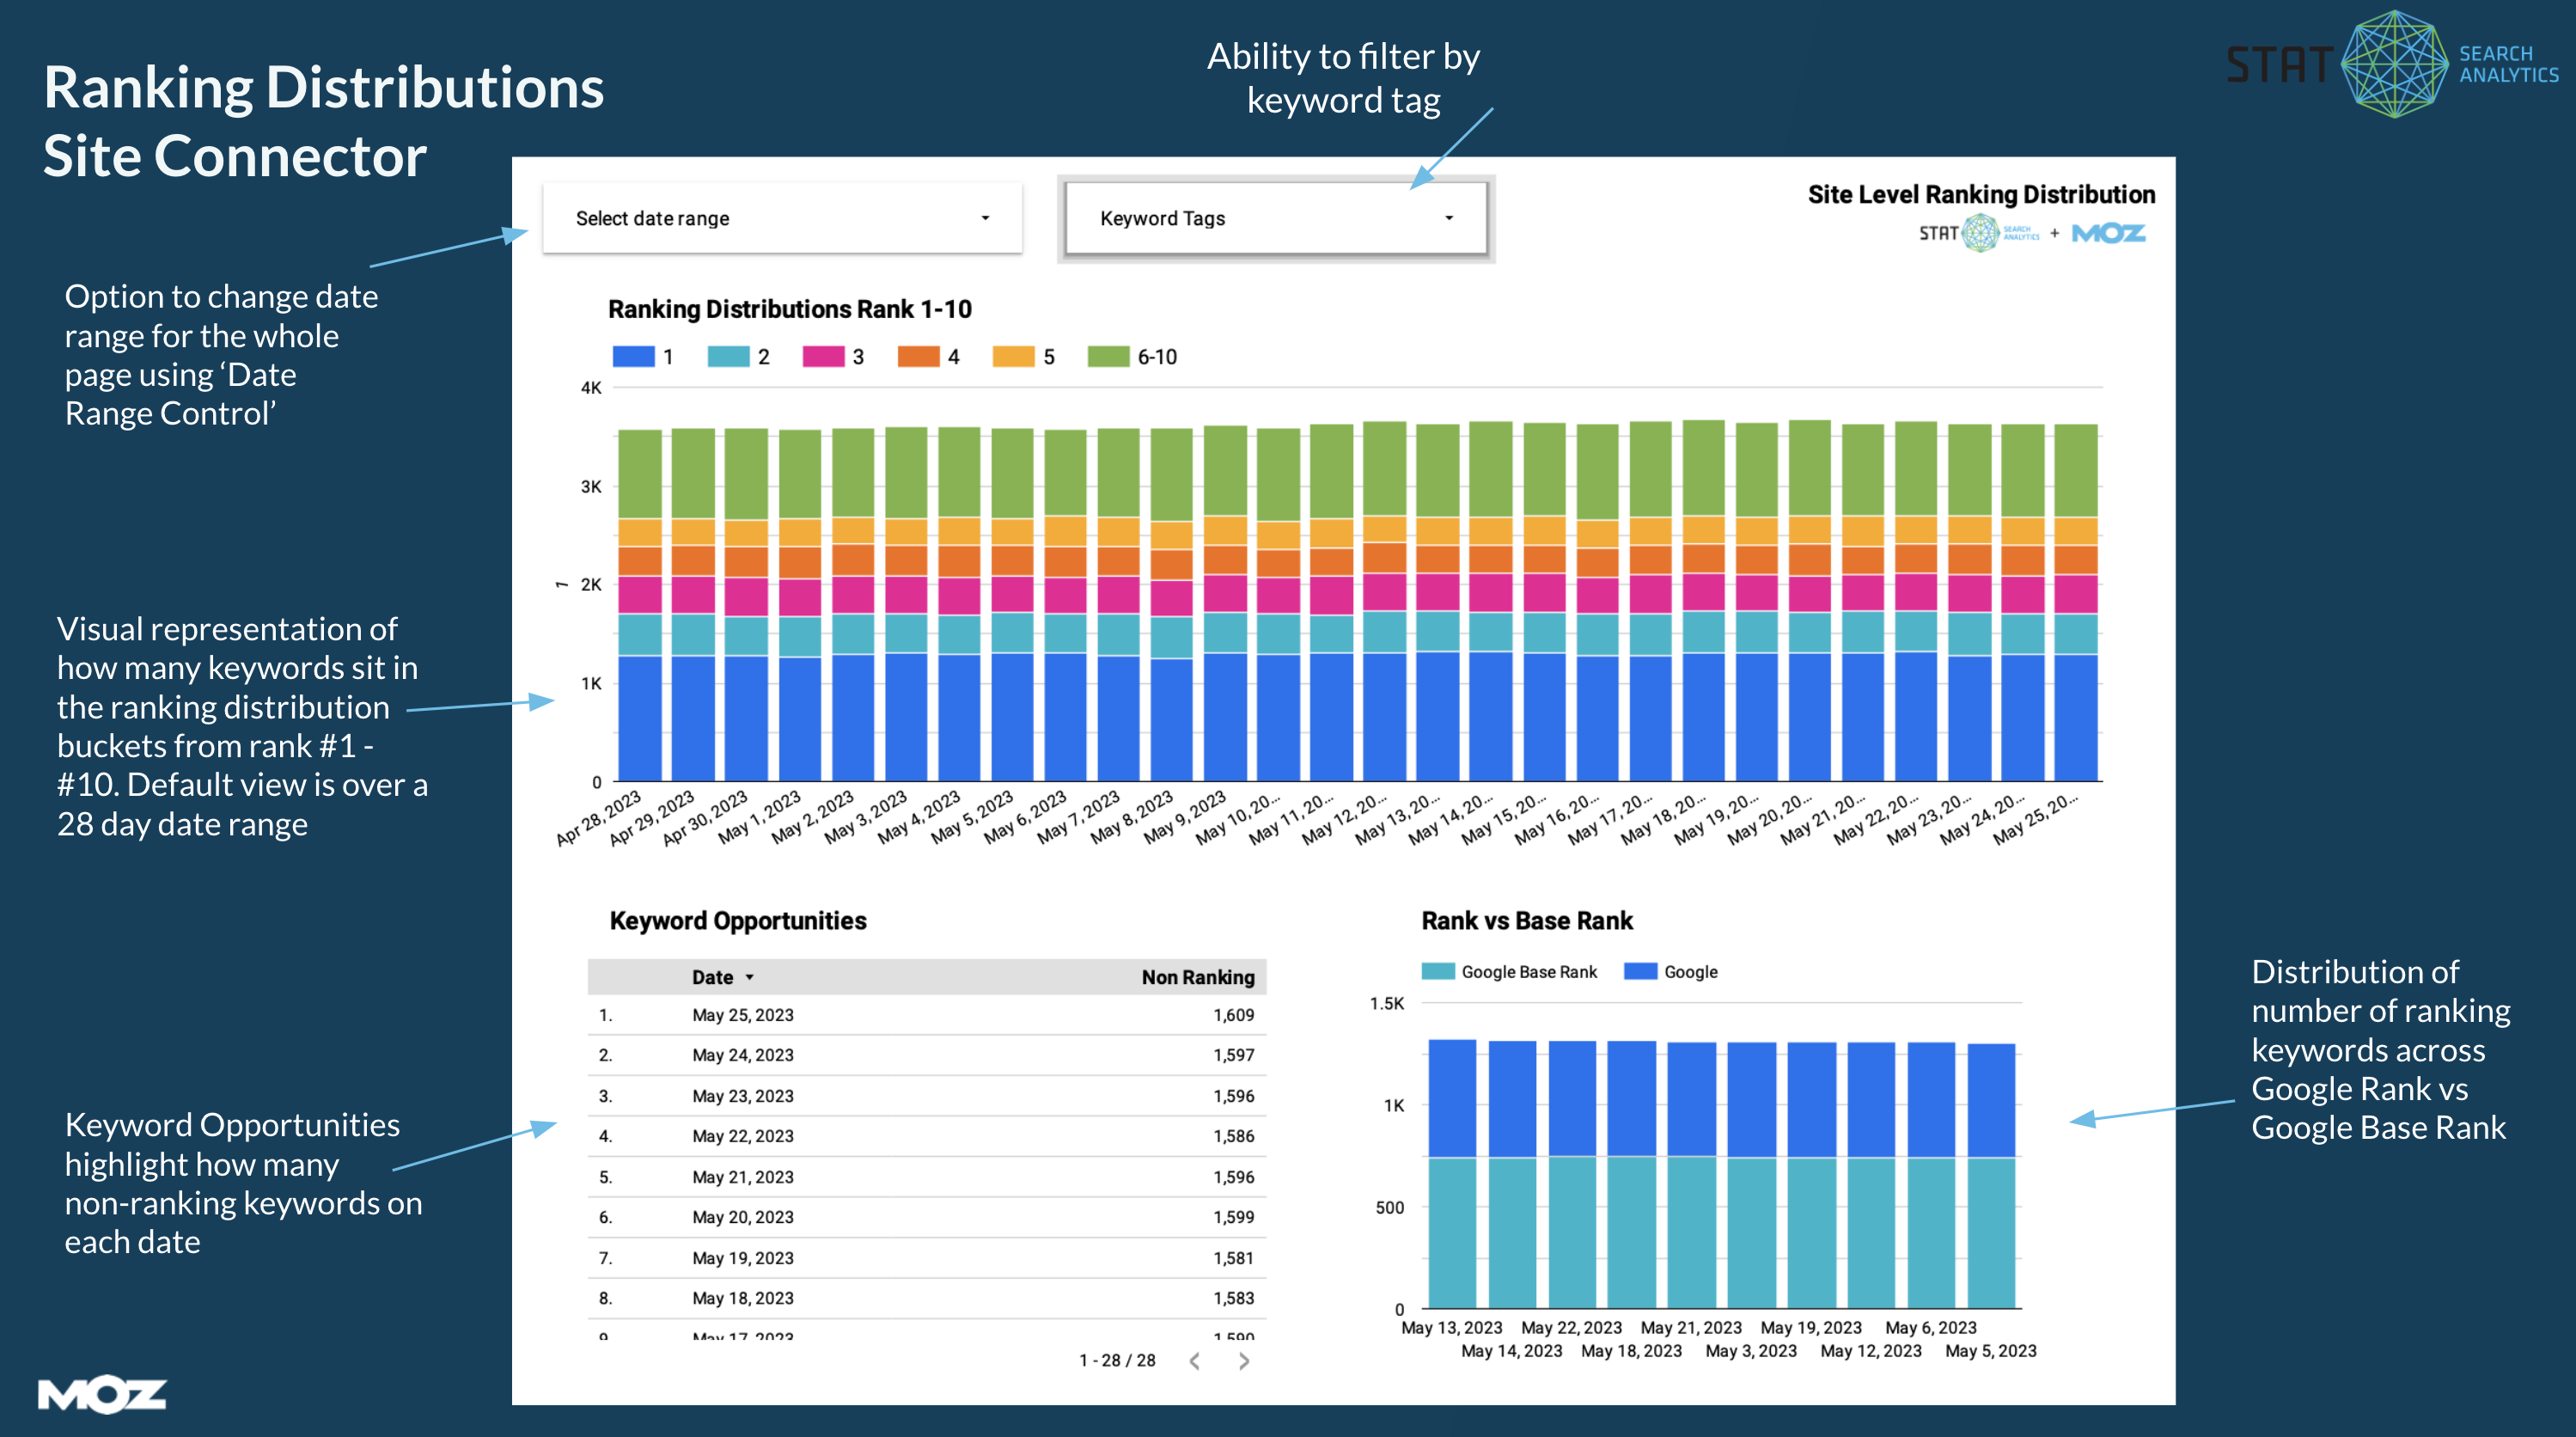
No, this isn’t a bug. The Site and Tag level Ranking Distributions connectors are limited to 31 days at a time.
Yes, absolutely, our connectors will work with both dynamic and standard tags.
Set up a connector step-by-step
Open the setup page for adding a site or tag connector by clicking on one of the links above.
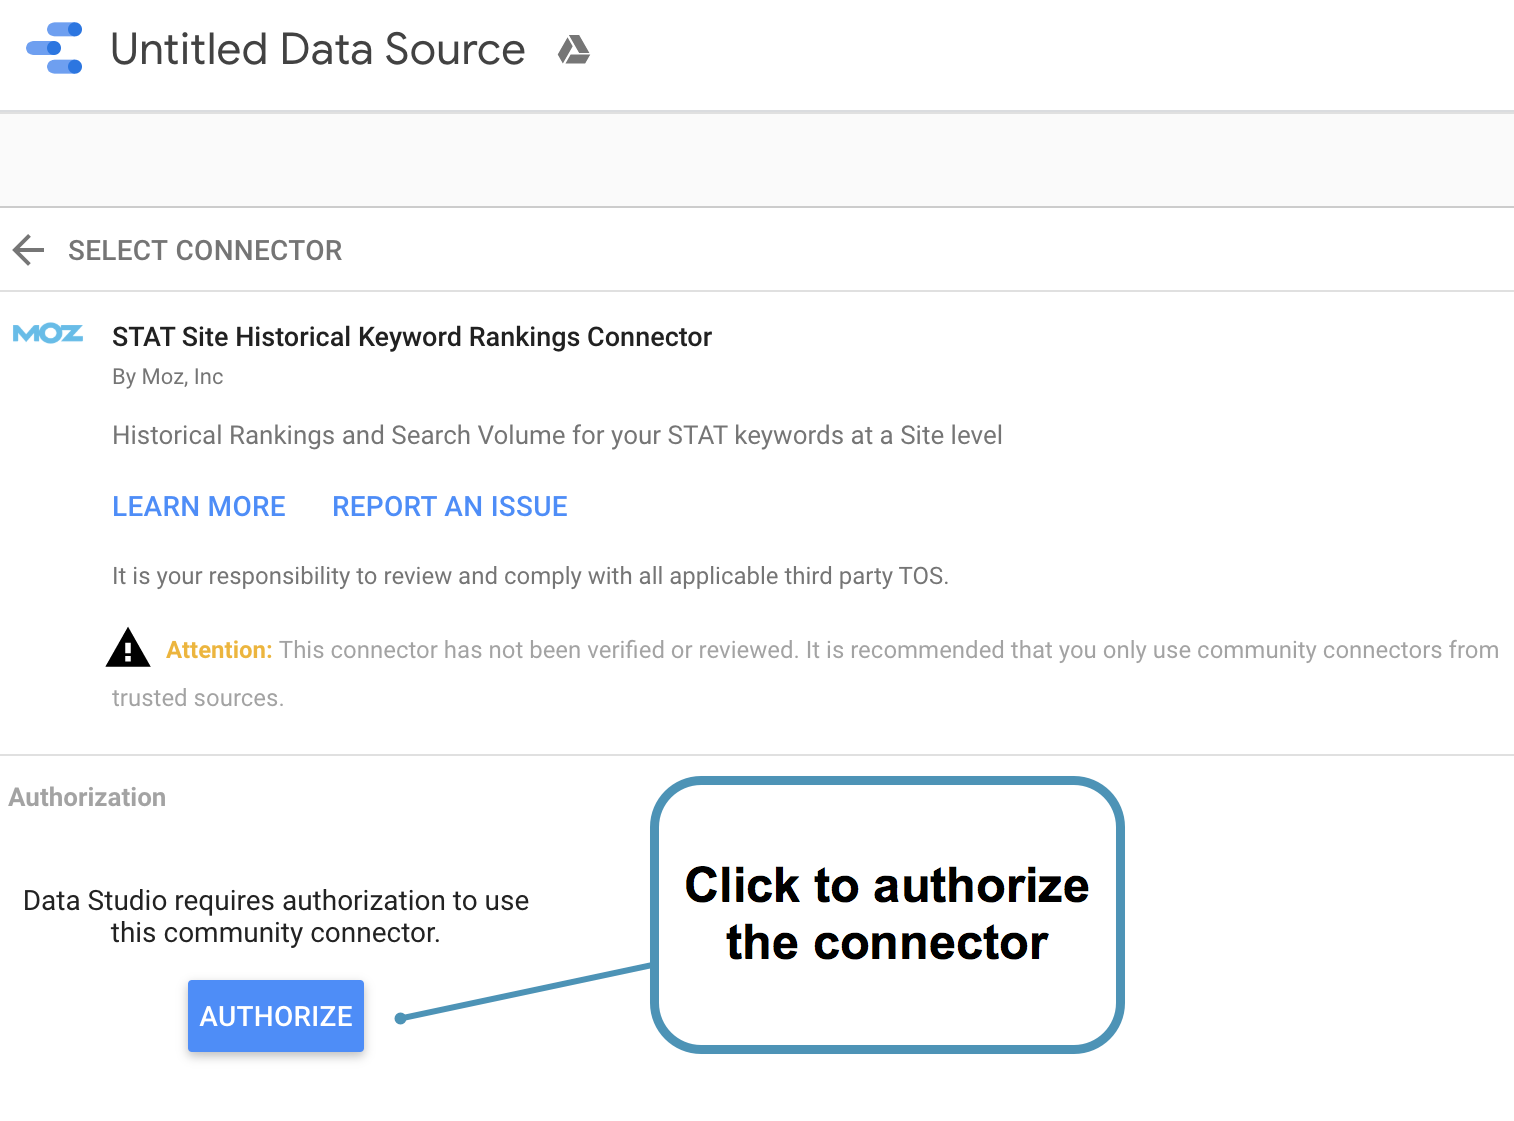
Once on the setup page, you will need to authorize Looker Studio to use the connector. Each connector you wish to use must be individually authorized on your Google account.
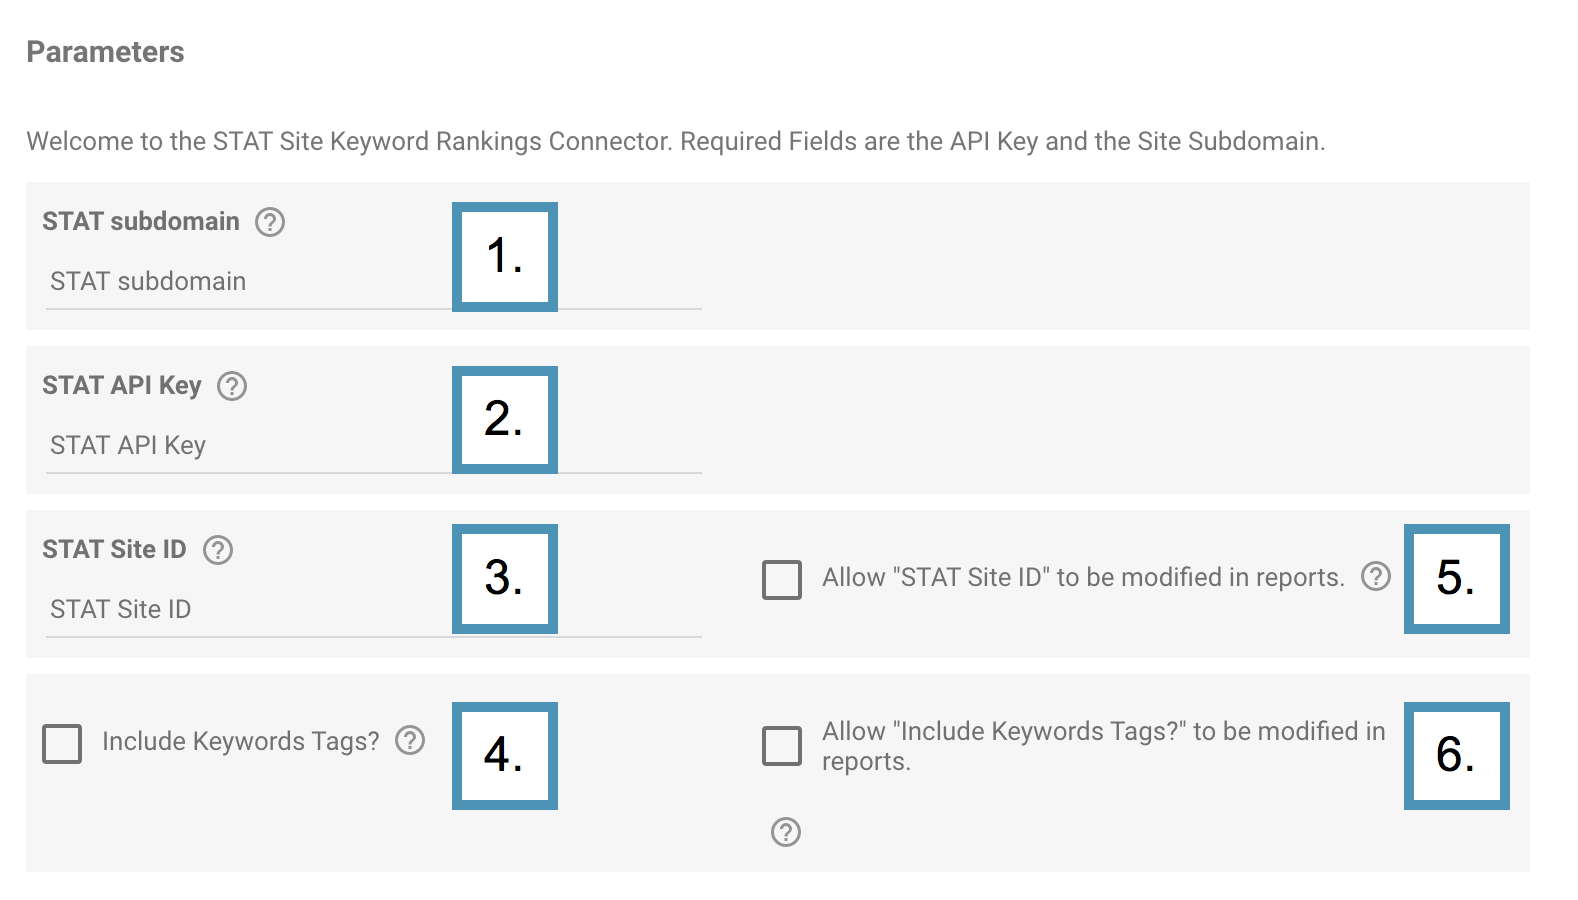
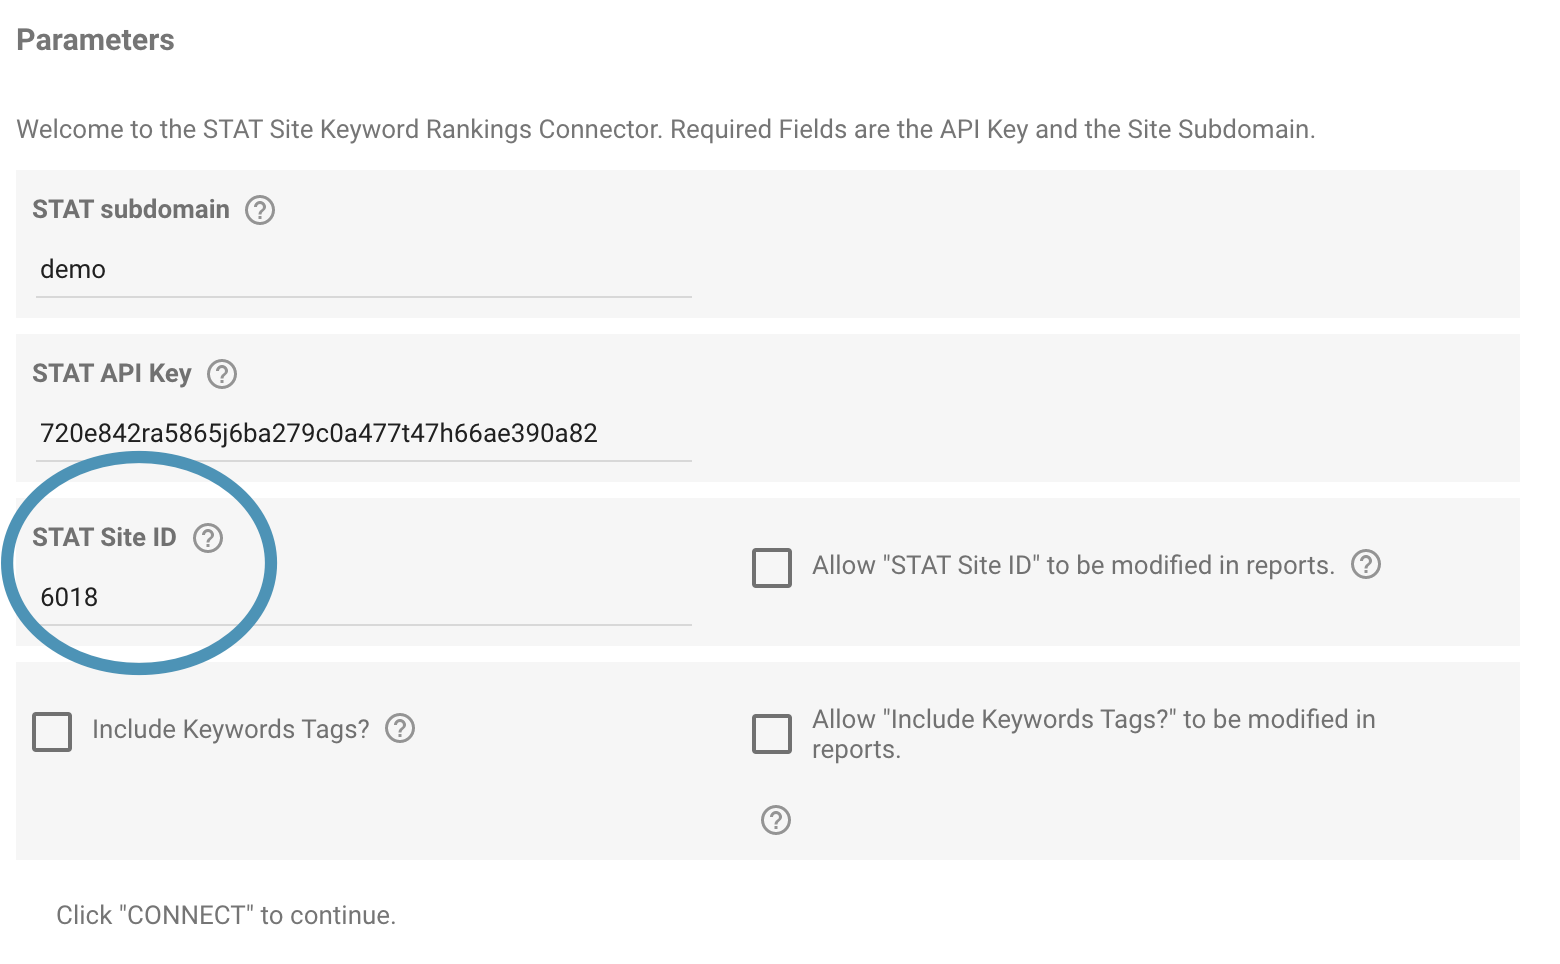
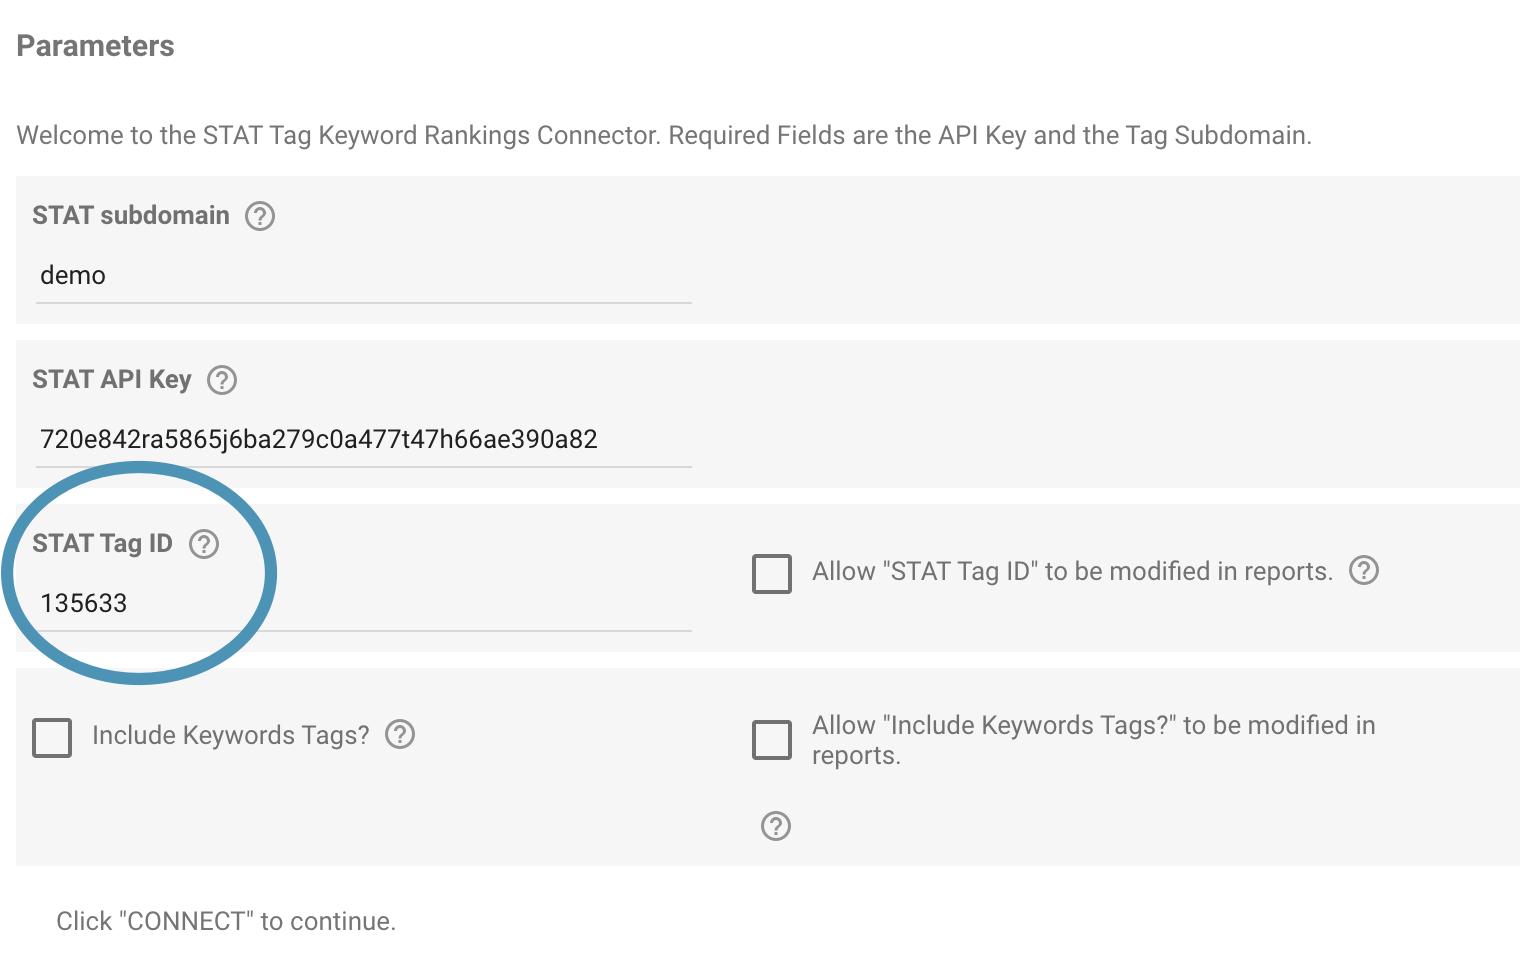
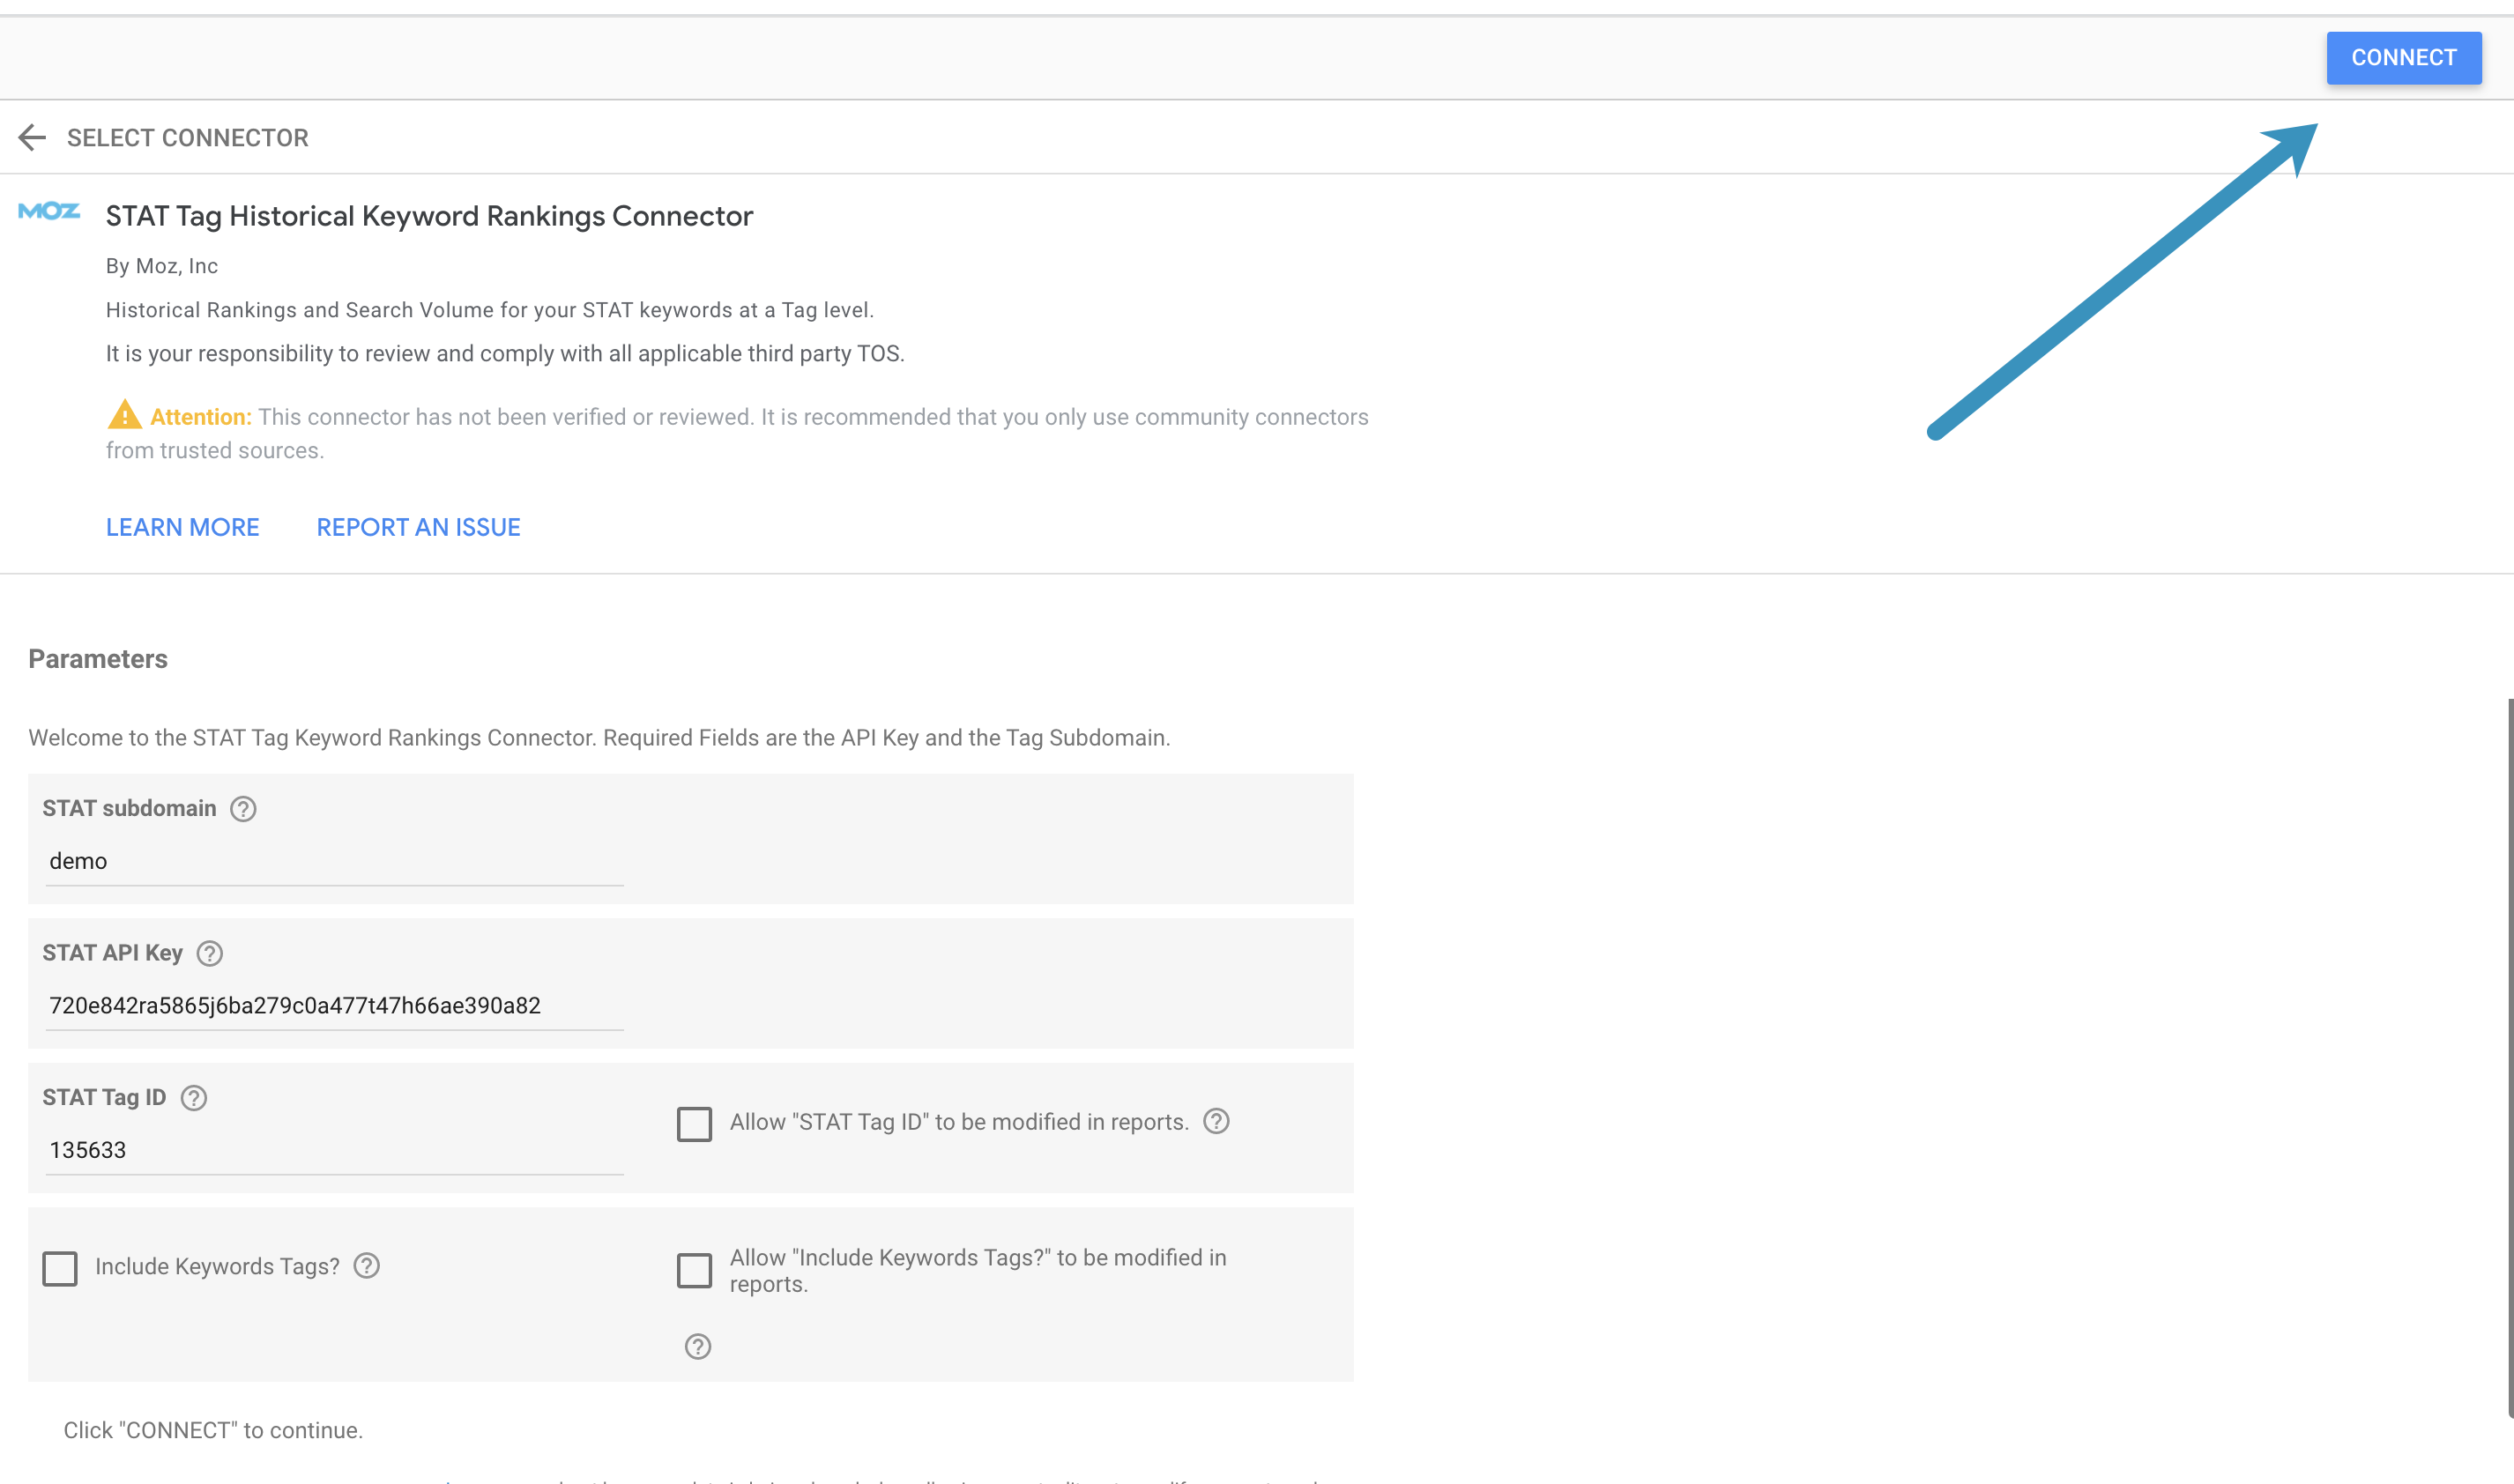
Once authorization has been given you’ll see the Parameters page where you’ll be able to enter details about your STAT account, API key and choose what values you want included in the report.
Complete the table fields in the table using the following information:
1. STAT Subdomain
This is the subdomain for the Looker Studio Connector to direct its request to the correct STAT subdomain. Complete this field with the subdomain of your STAT login URL.
2. STAT API Key
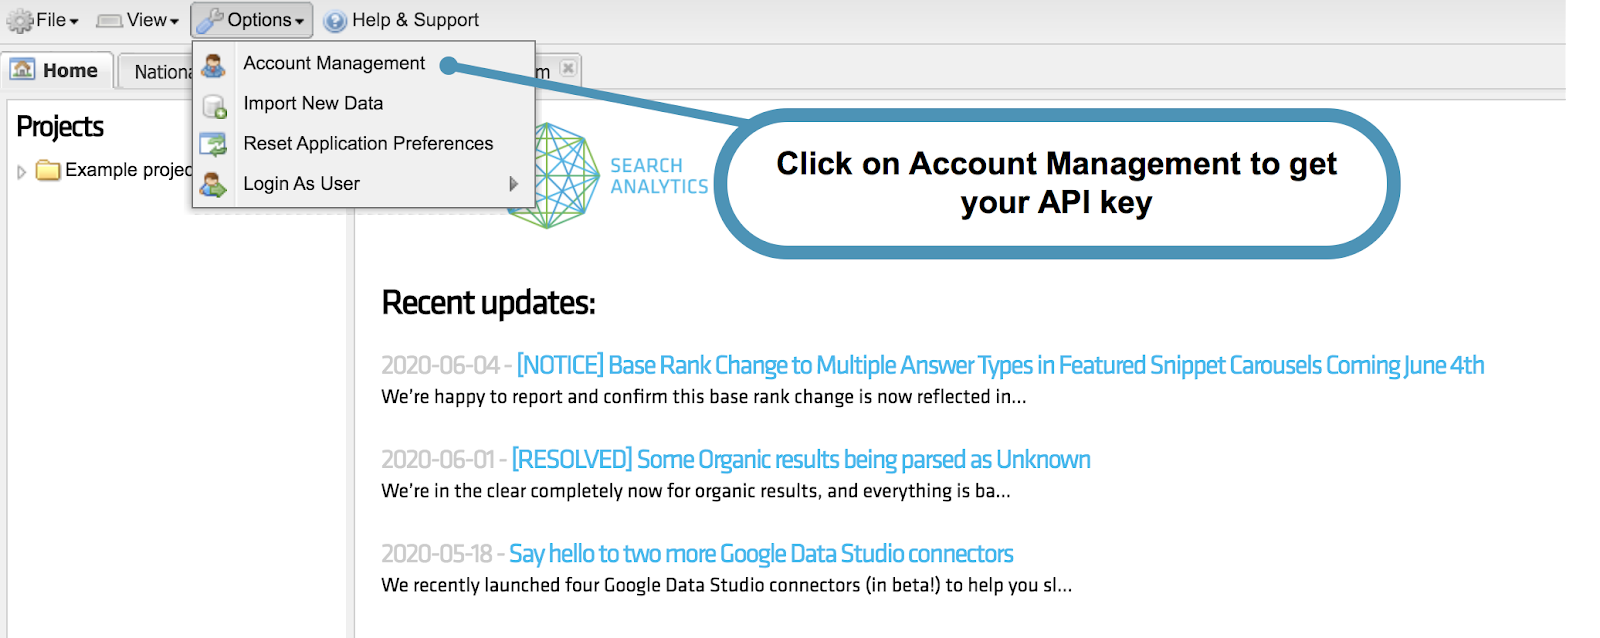
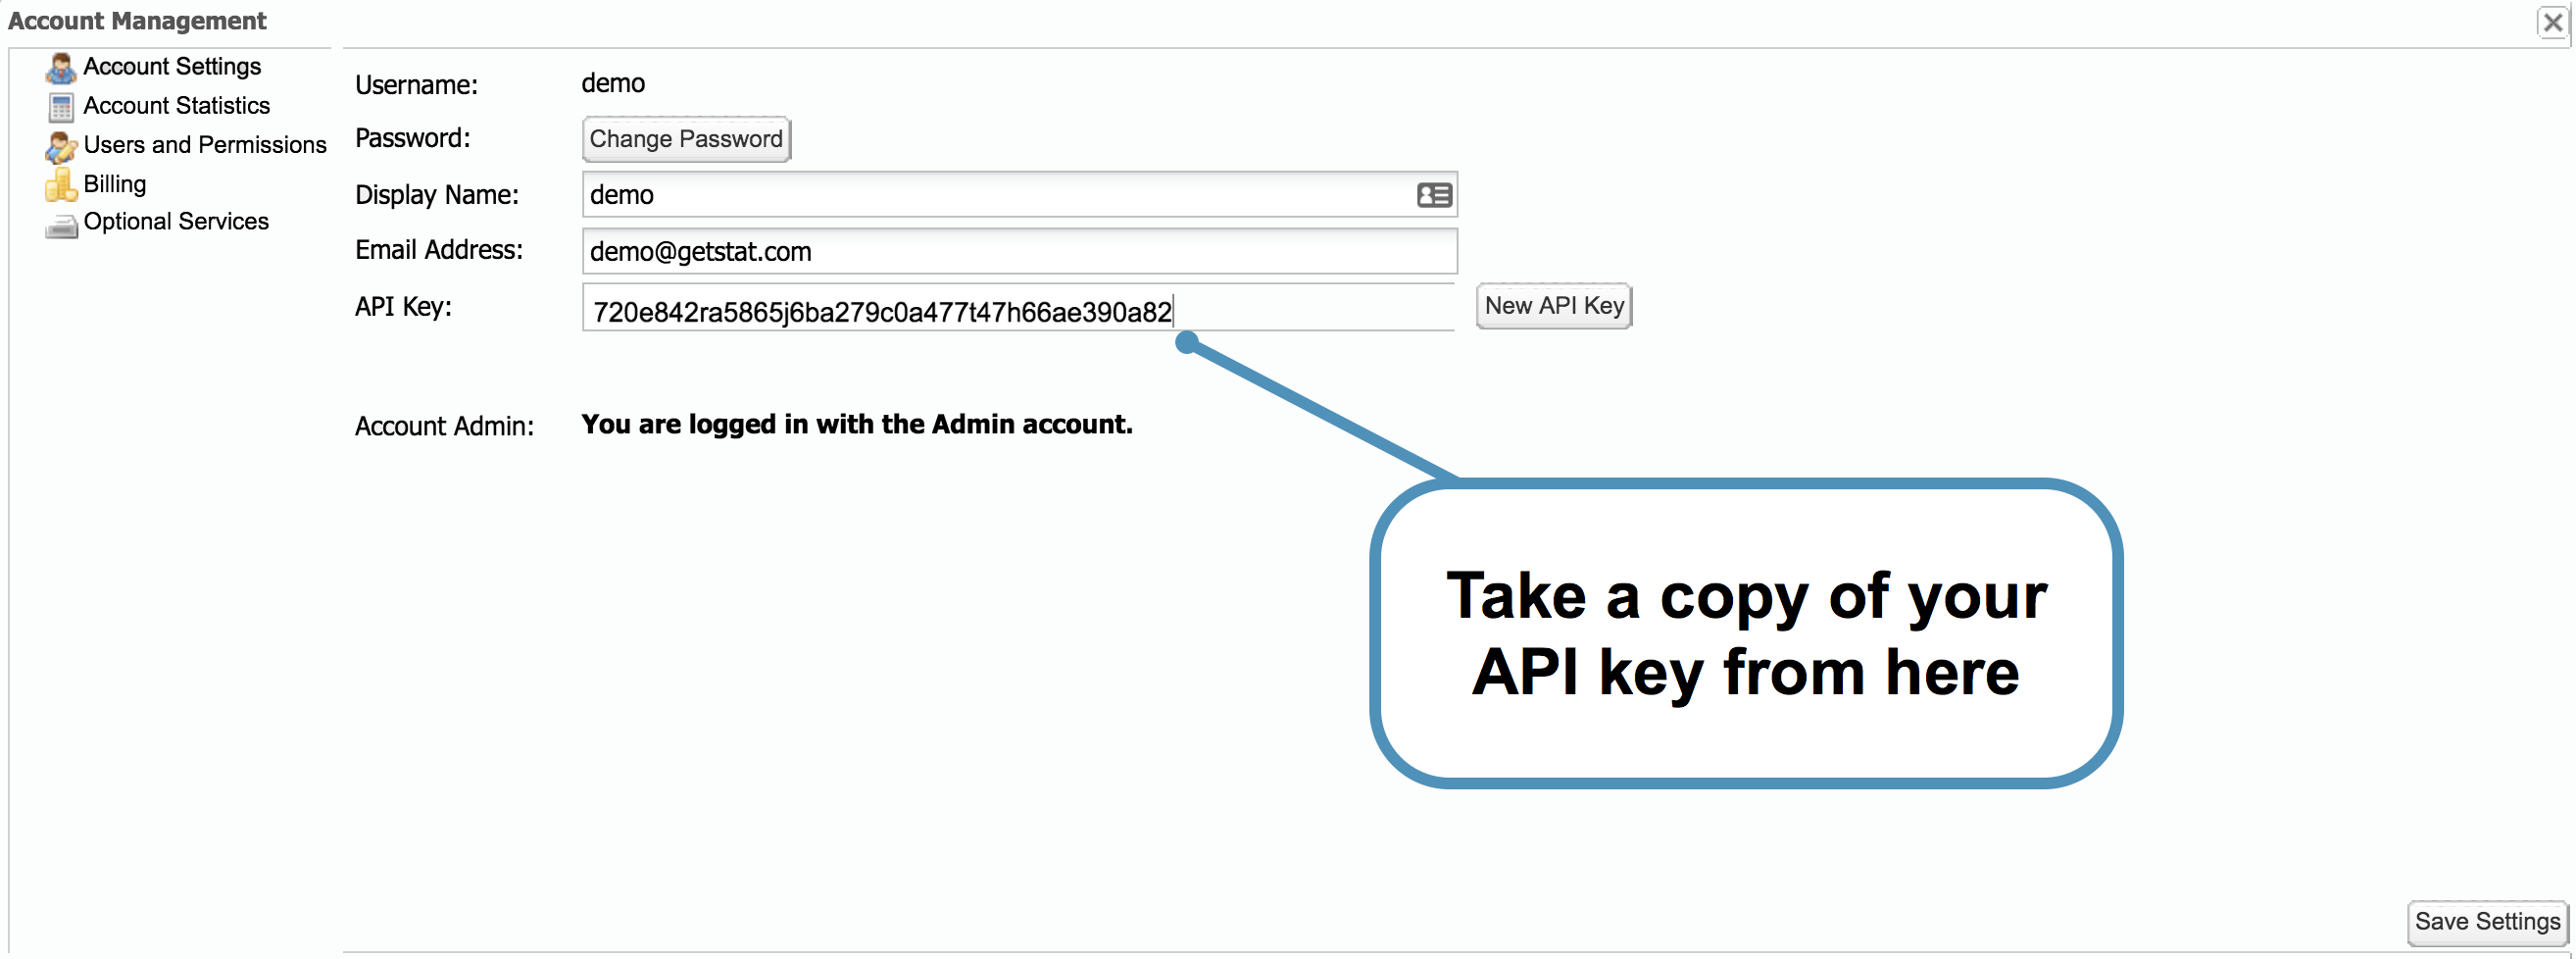
Find the key by going into your STAT account and clicking on Options > Account Management > Account Settings > API Key
3. STAT Site/Tag ID
The easiest way to get IDs is through an API tool. You can download and install free tools, such as Postman, to retrieve IDs.
To make these API calls you’ll need to have some details from points 1 and 2 to hand; the subdomain of your STAT login URL and API key. You’ll use these details in each API call you make.
- First, you’ll need to find the Project ID. This should be for the STAT project that contains the site you want to use. To find this, use the URL below to make the API call, in Postman or whatever API tool you’ve chosen to use. Remember to edit the URL so it contains your own STAT subdomain and API key.
YOUR_SUBDOMAIN.getstat.com/api/v2/YOUR_API_KEY/projects/list?format=json
- Once you’ve found your project ID you can use it to get your Site ID. Copy the URL below into your API tool to make the call. Edit the URL to include your STAT subdomain, API key and project ID.
YOUR_SUBDOMAIN.getstat.com/api/v2/YOUR_API_KEY/sites/list?format=json&project_id=PROJECT_ID
- If you’re adding a tag level connector, you’ll need to go one step further to find your Tag ID. Copy and paste the URL below into your API tool, remembering to edit it so it contains your STAT subdomain, API key and site ID.
YOUR_SUBDOMAIN.getstat.com/api/v2/YOUR_API_KEY/tags/list?format=json&site_id=YOUR_SITE_ID
You can find a list of all our API requests and responses here.
4. Include keyword tags (only on site and tag historical keyword rankings connectors)
By checking this box, a column will be added in the report for keyword tags. However, because it uses more Google Apps Script cache space it will reduce the amount of data that can be requested.
5. Allow “STAT Tag ID” to be modified in reports
By checking this box you’ll be able to input this value in the report itself.
6. Allow “Include Keywords Tags” to be modified in reports (only on site and tag historical keyword rankings connectors)
By checking this box you’ll be able to modify this value to request additional or different data.
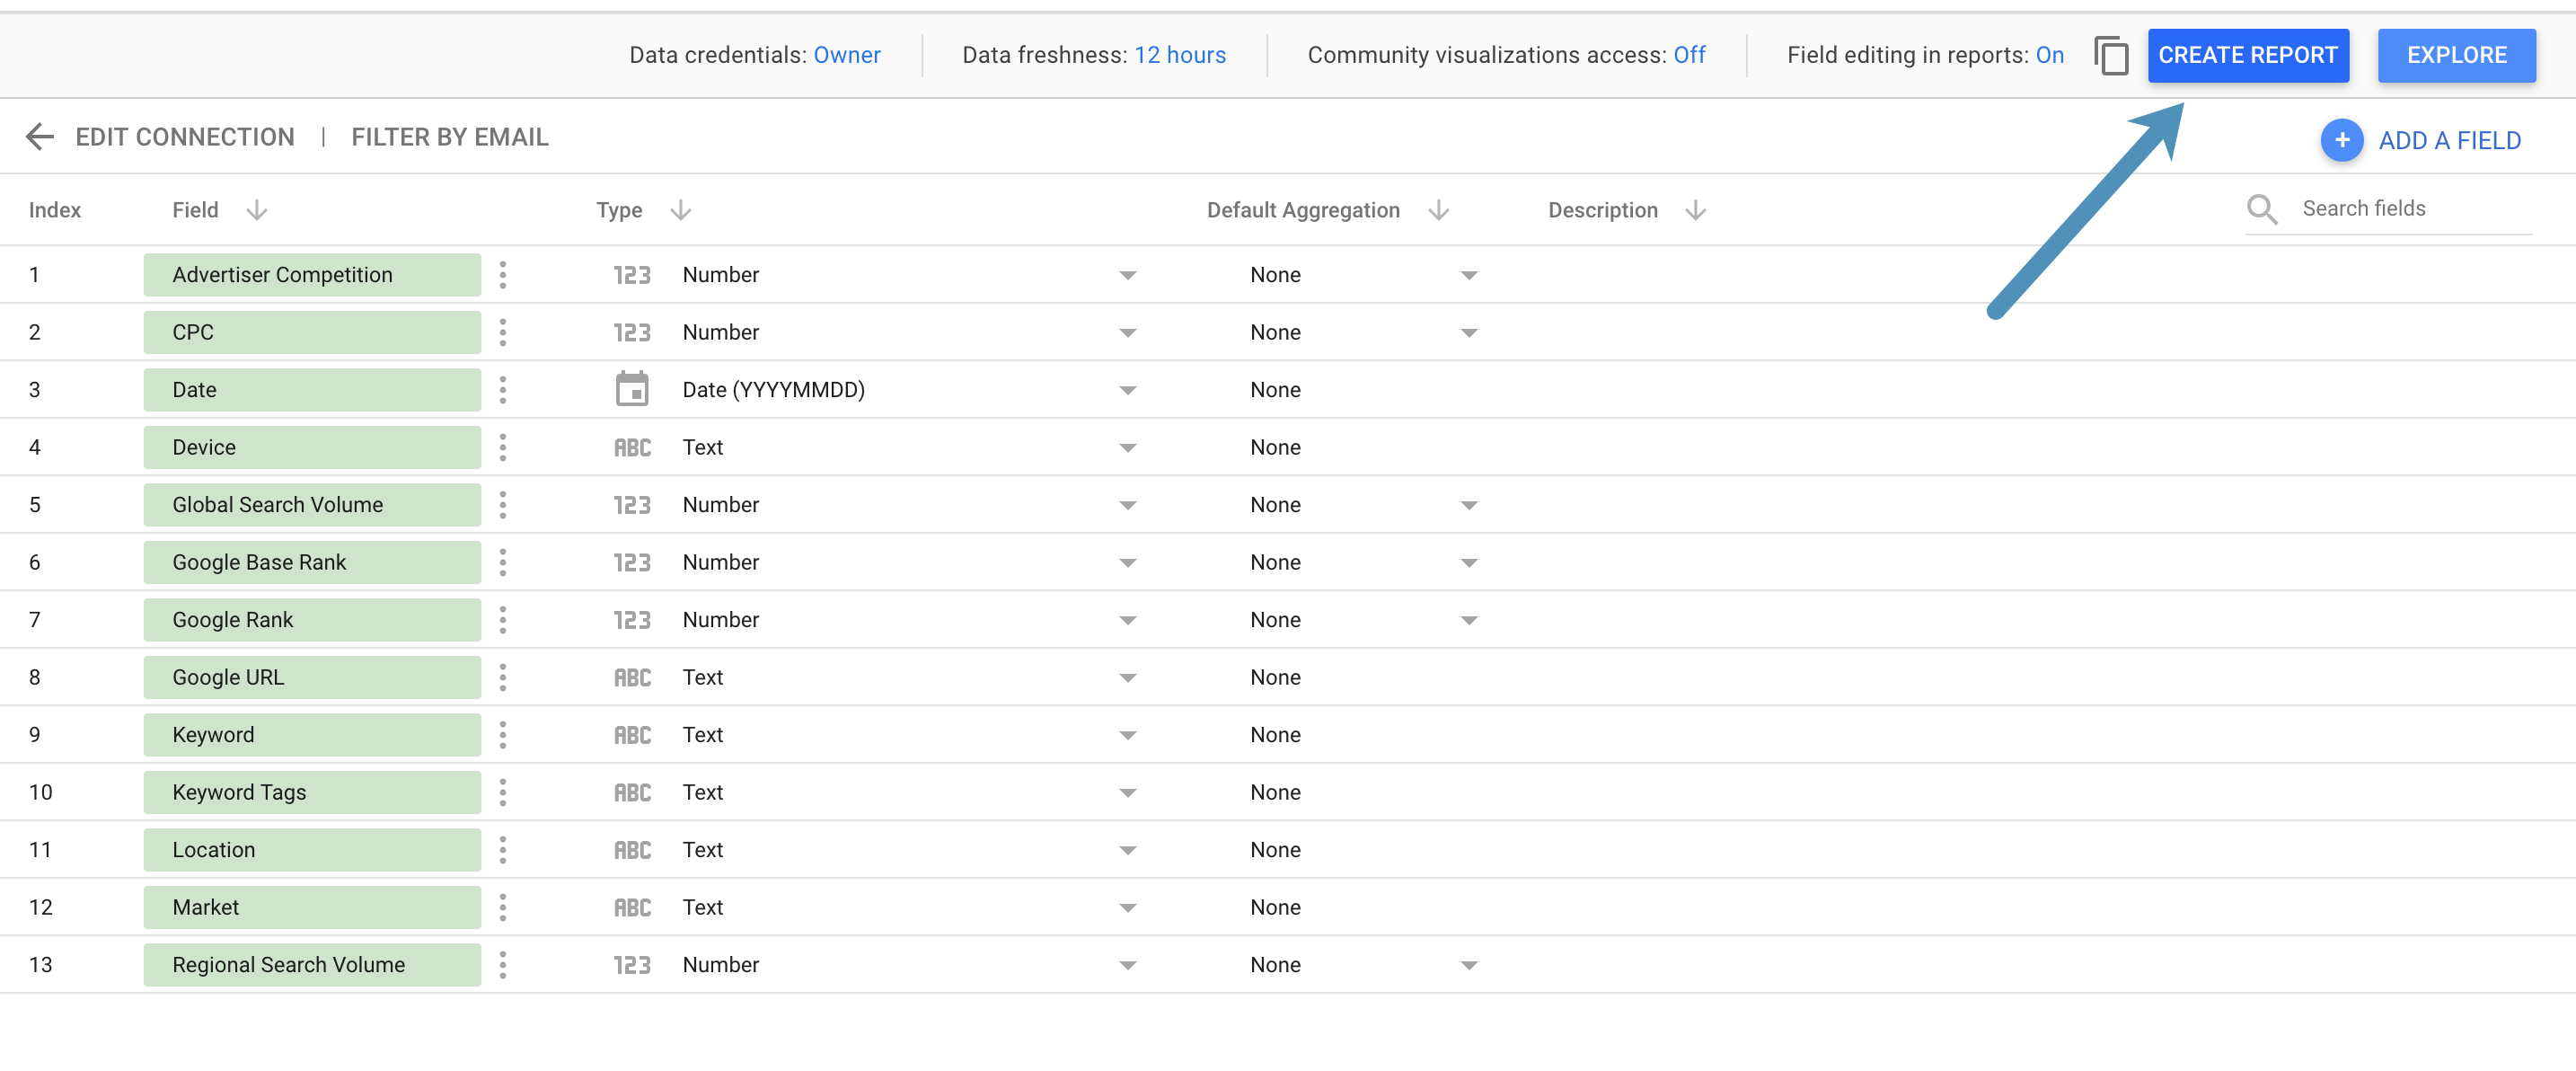
Once the table has been completed, click Connect in the top right-hand corner.
Next, you’ll be given the opportunity to confirm which columns you want available in the report. Once you’ve reviewed the columns, click Create Report.
Looker Studio Reporting
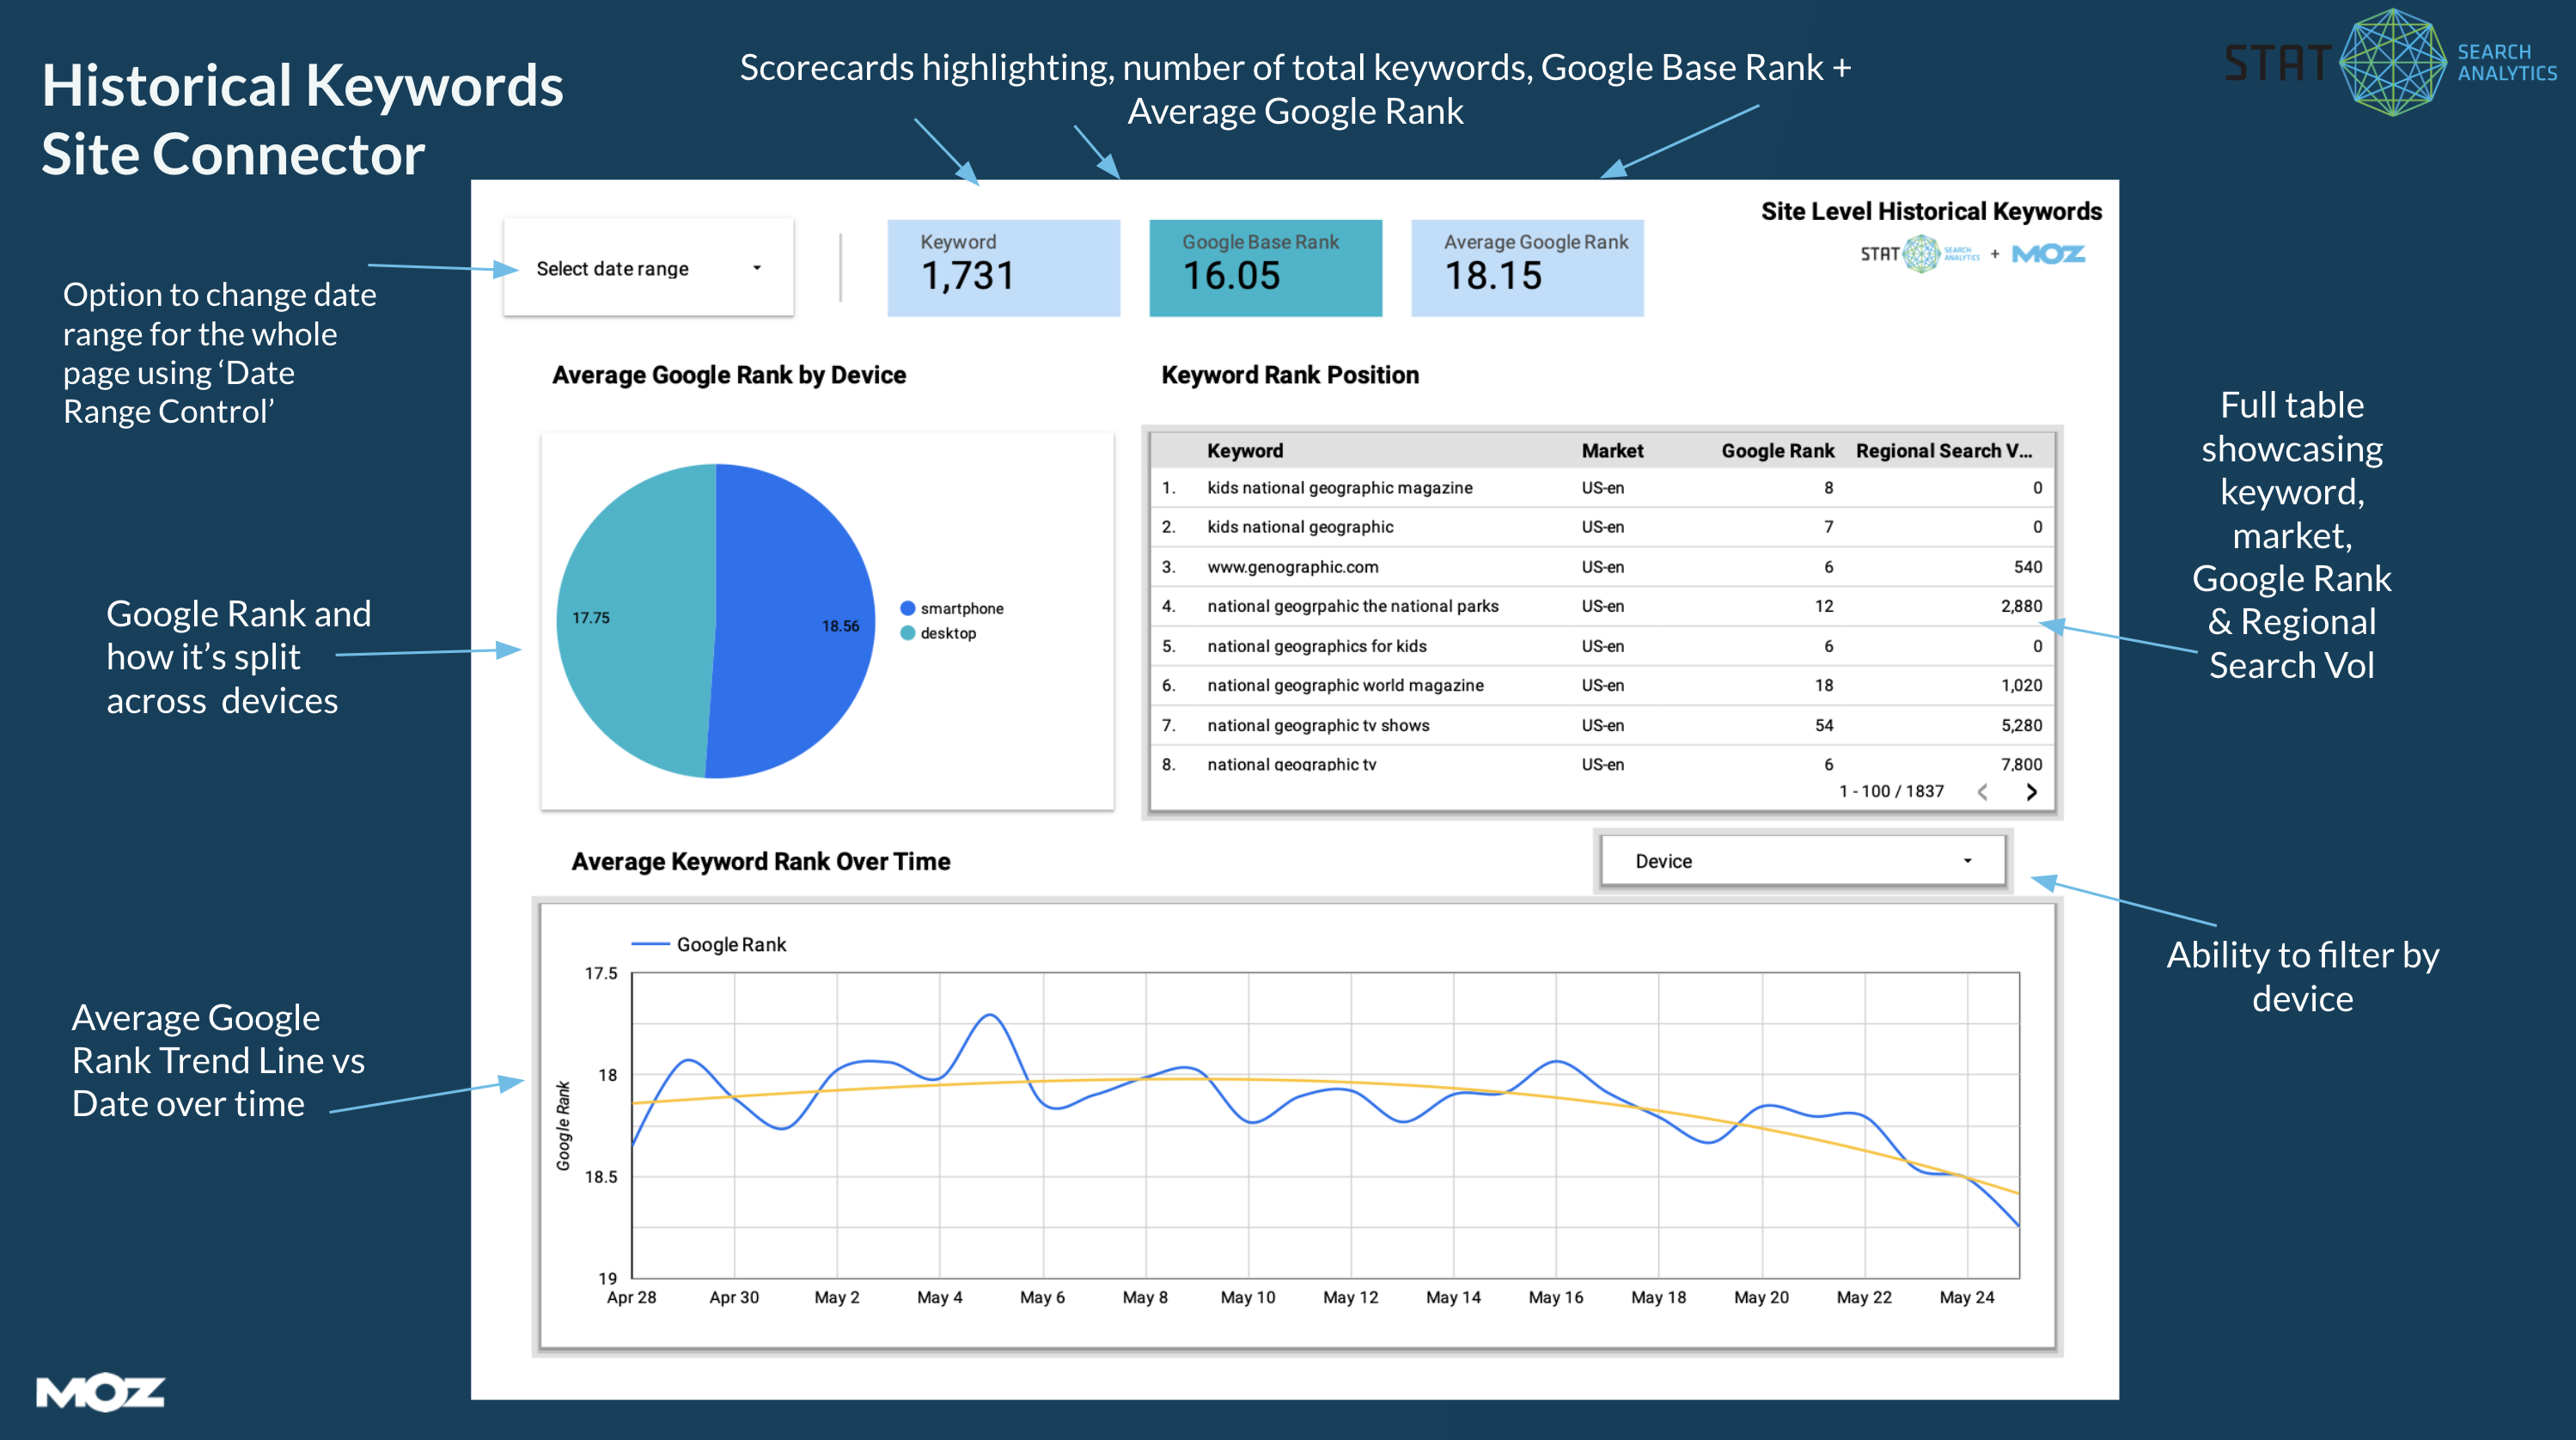
Looker Studio will automatically generate a table and start pulling the last 28 days of historical data.
On the initial load, we recommend you wait for the table to populate with data before going to the step below.
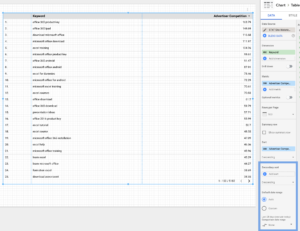
Once the data loads, you’ll see a reporting screen similar to this:
Adding fields to your Looker Studio report
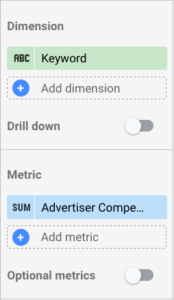
In order to make better use of this data, you can add dimensions and metrics.
Dimensions are typically date and text columns such as a Google URL, whereas metrics usually include numerical columns such as Google Rank and CPC.
1. Add dimensions and metrics by selecting them in the right-hand side tool.
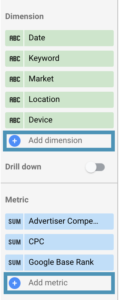
2. Click the |+| button to add new dimensions and metrics.
3. Once you’ve added in new columns, your table will look similar to this:
Selecting a date range and ordering your data
1. In the right-hand side tool, you can scroll down to see Secondary sort and Default date Range options.
2. You can choose how you want to sort this data; typically historical ranking data is sorted by date. You can also set a custom date range in the Default date range selector.
3. Select custom, then click the box below to set a preferred date range.
For information on setting up a rolling date window, follow the instructions on the Looker Studio Help page.
Report examples
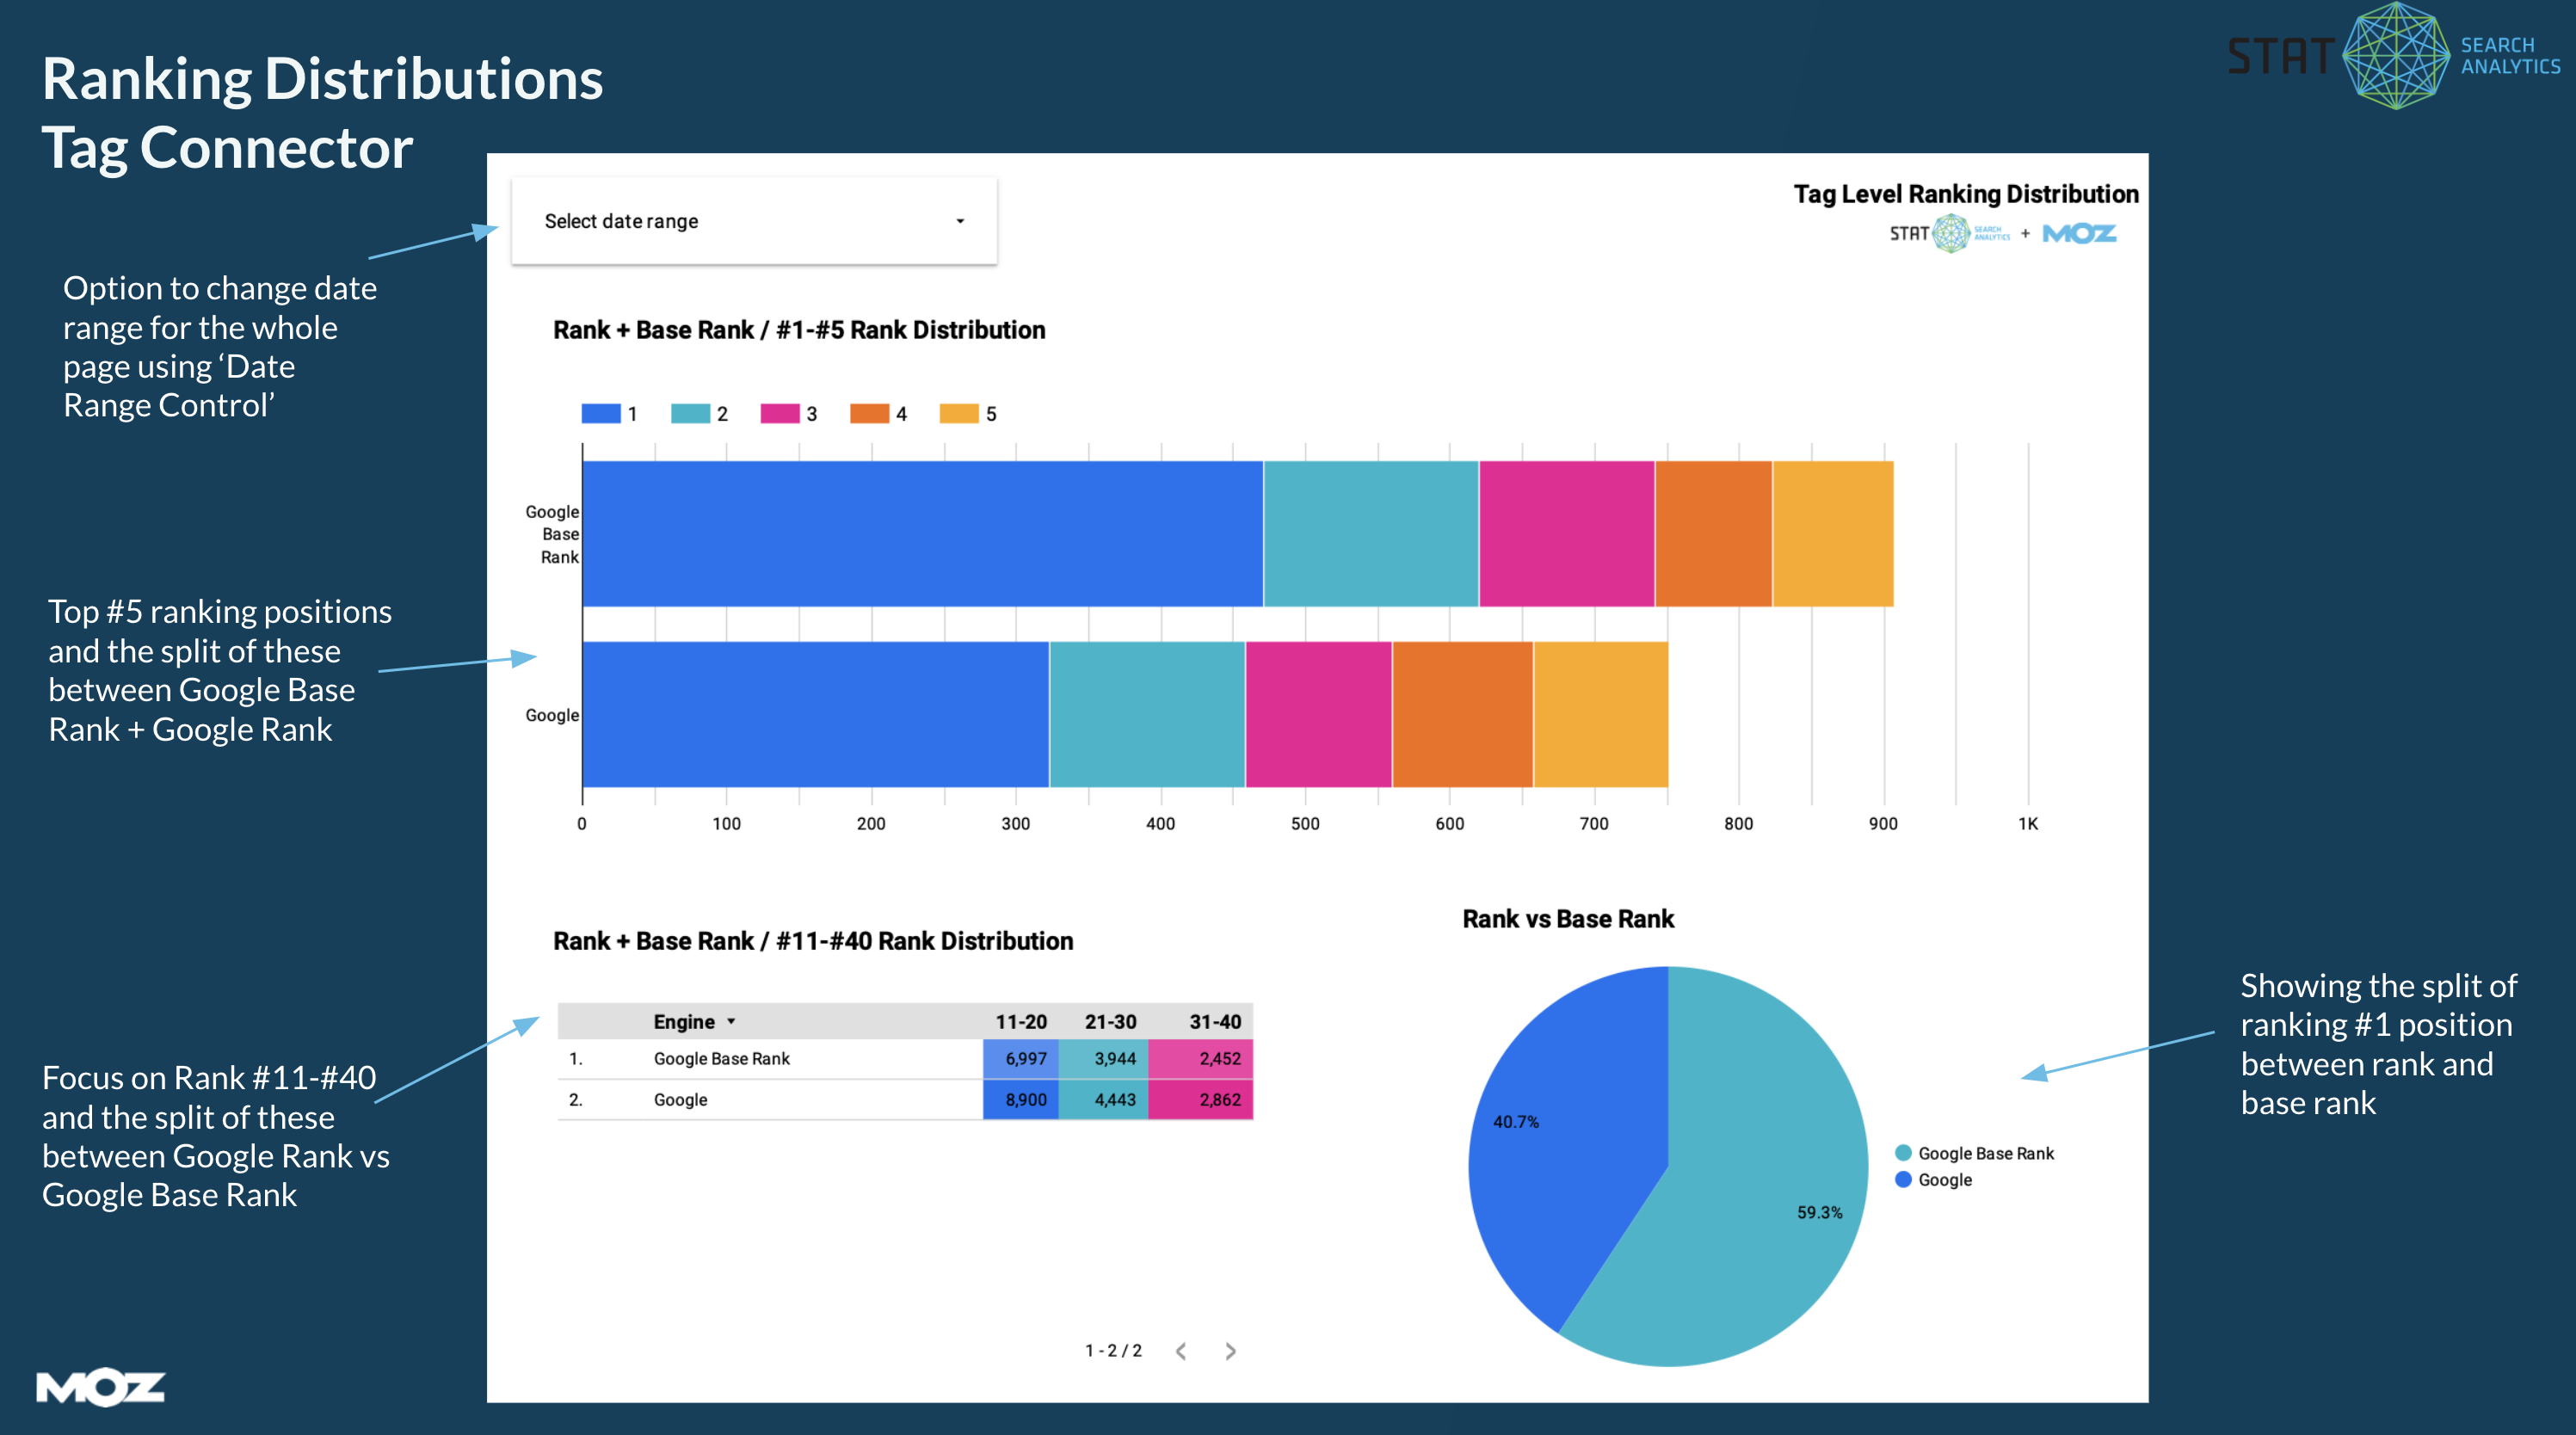
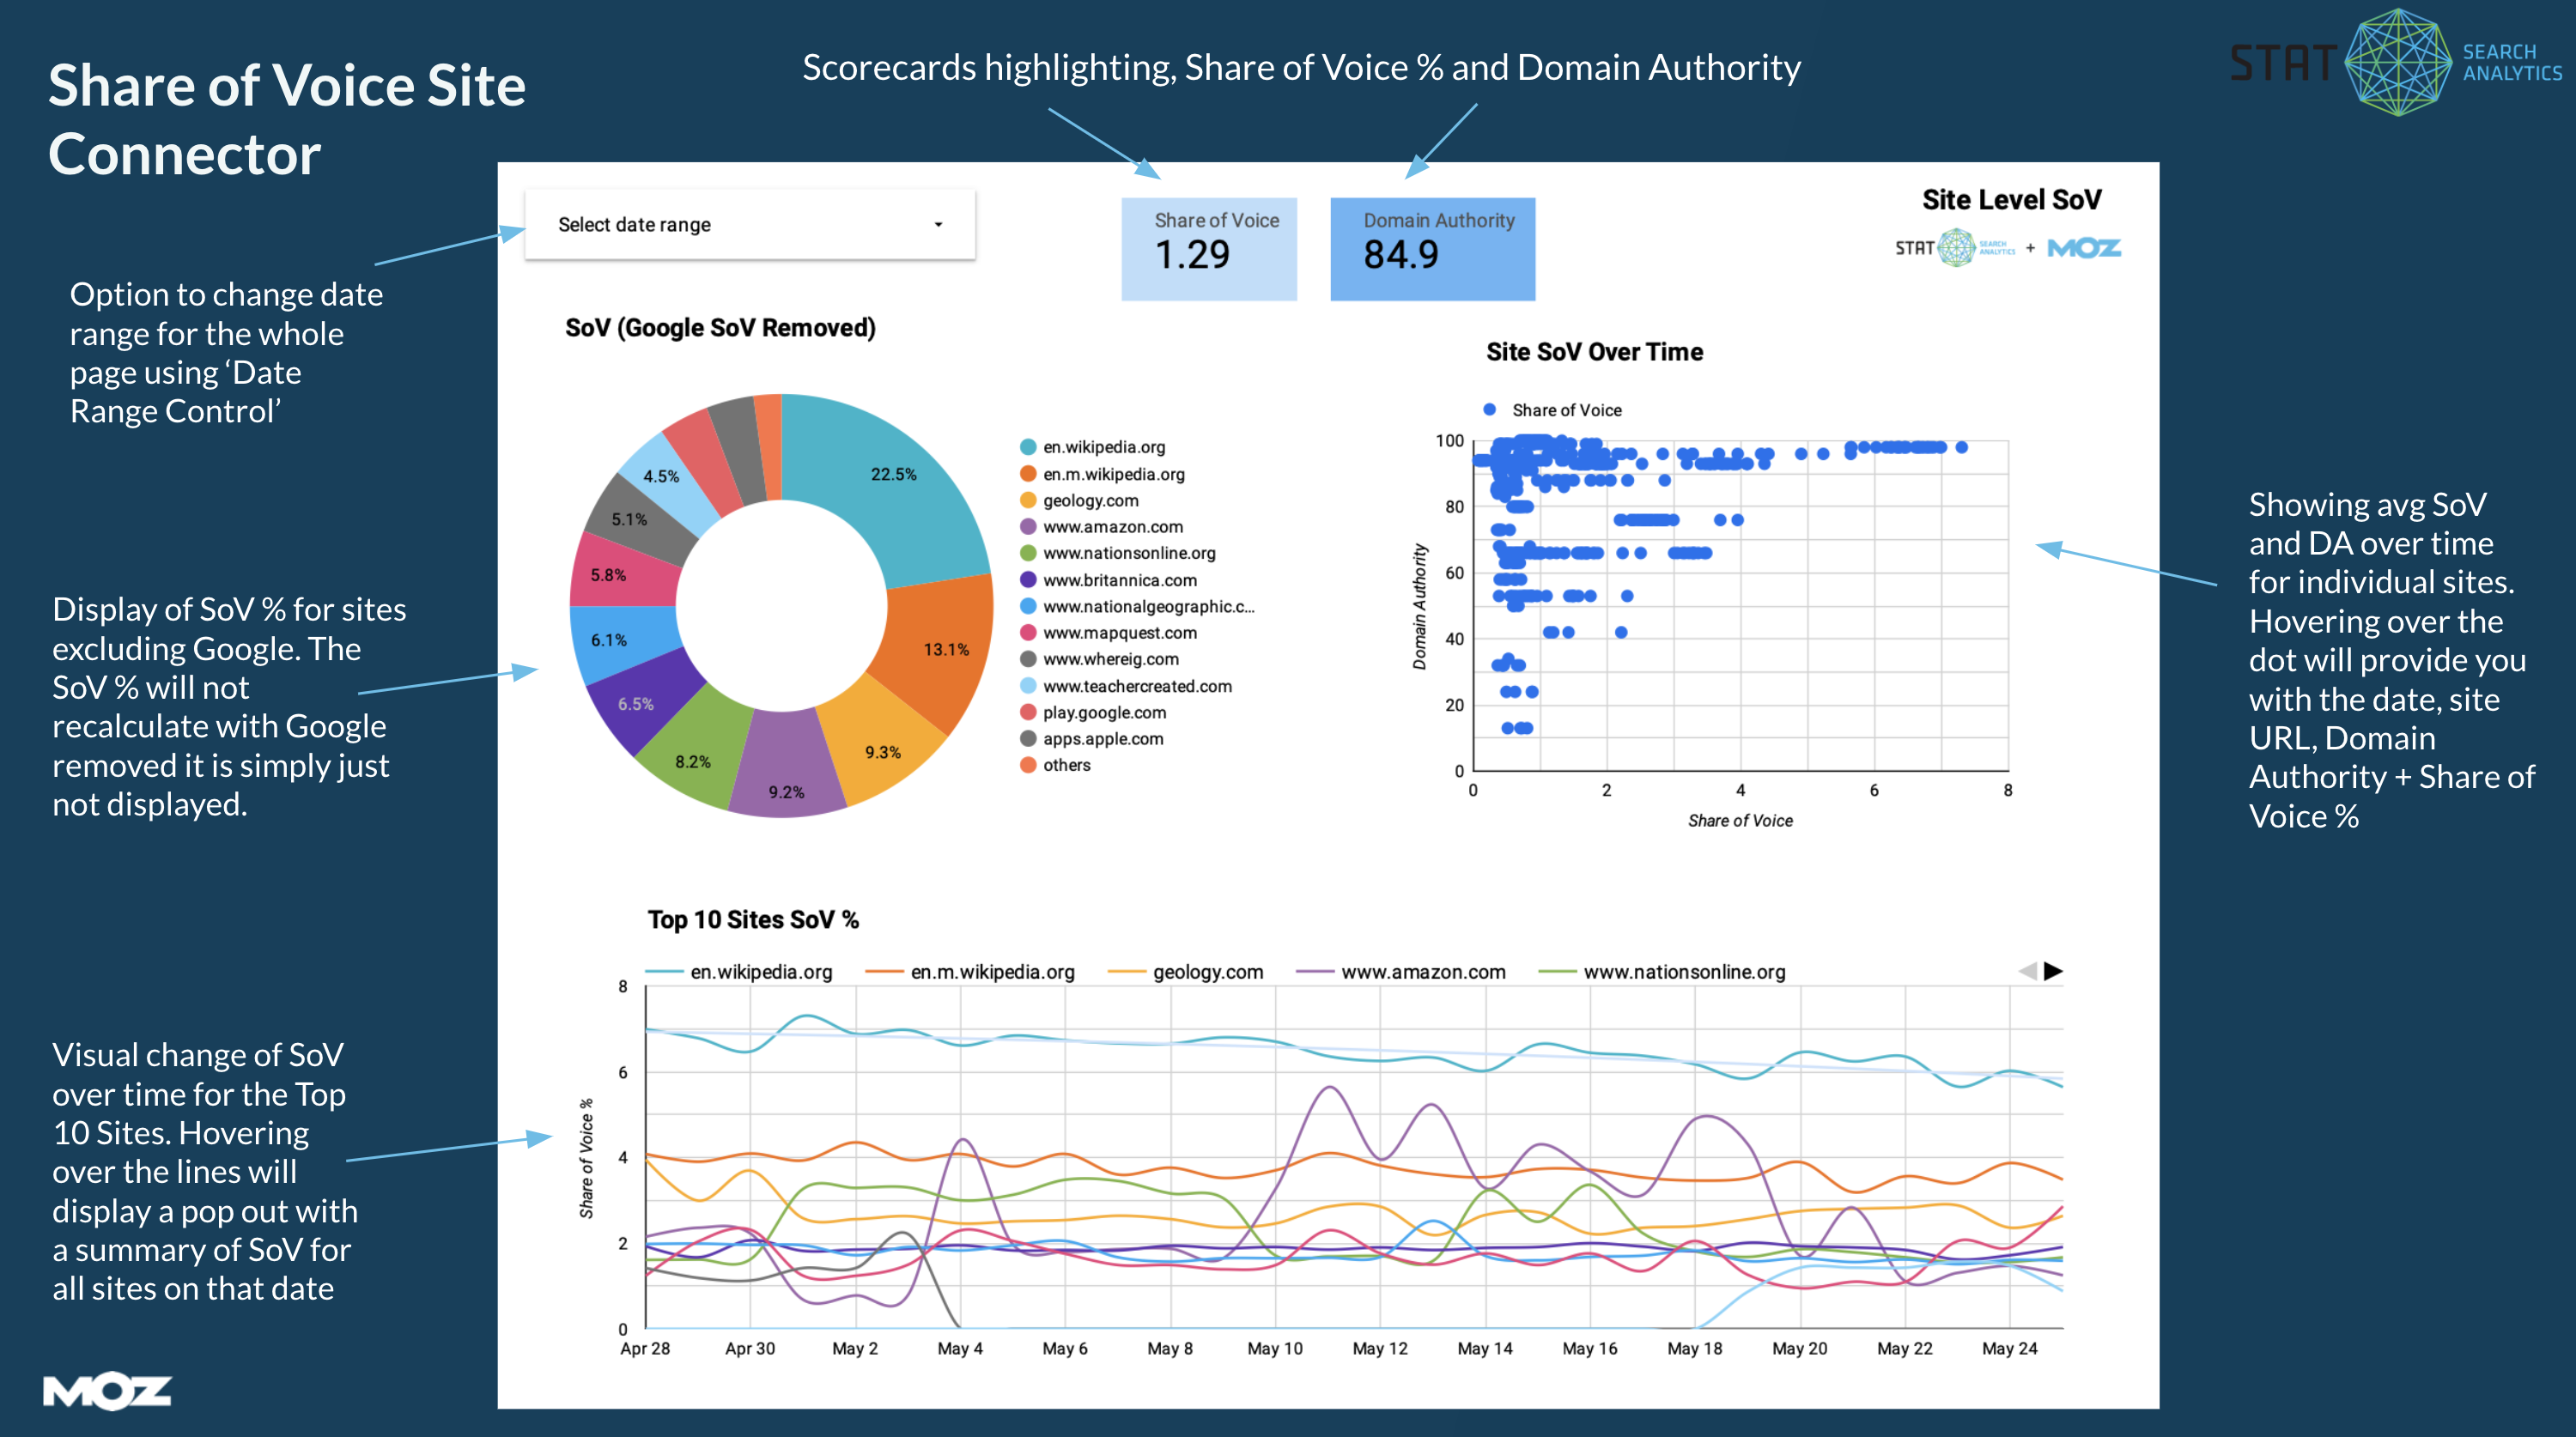
Below are some report examples for both site and tag Looker Studio connectors:
Connector outputs
Outputs from the Historical Keywords Ranking connectors
| Name | Type (number, string, boolean) | Description |
| Date | string | Date for the keyword’s rankings |
| Keyword | string | The keyword itself |
| Market | string | The market for the keyword |
| Location | string | The location for the keyword |
| Device | string | The device for the keyword |
| Tags | string | A comma-separated list of tags associated to the keyword |
| Advertiser Competition | number | Advertiser Competition for the keyword |
| Global Search Volume | number | Latest Global SV for the keyword |
| Regional Search Volume | number | Latest Regional SV for the keyword |
| Google Rank | number | Google Ranking data for the keyword for that specific date |
| Google Base Rank | number | Google Base Rank for the keyword for that specific date |
| Google URL | string | Google Ranking URL for the keyword for that specific date |
| CPC | number | Cost per click |
Outputs from the Share Of Voice connectors
| Name | Type (number, string, boolean) | Description |
| Date | string | Date for the keyword’s rankings |
| Domain Authority | number | Current Domain Authority score, regardless of reporting period |
| Pinned | boolean | True if the site is pinned, and false if it is not pinned |
| Share of Voice | string | Measurement of the visibility of a given keyword set on Google |
| Site | string | Site domain |
Outputs from the Ranking Distribution connectors
| Name | Type (number, string, boolean) | Description |
| Date | string | Date for the keyword’s rankings |
| Engine | string | Currently only Google |
| Ranking Distribution buckets | number | The connectors return the same ranking distribution buckets as in STAT, e.g. 1, 2, 3, 4-10, 11-20, 21-119 |
| Non Ranking | string | Count of keywords which are non-ranking |
Reporting ranges
You’re able to request up to 310,000 rows of ranking data with any of our connectors. For keyword ranking data a row is ranking data for one keyword for one day. This allows you to do month over month reporting for a site of 5000 keywords or less — any combination of keywords x days = 310,000.
The Ranking Distributions Connectors are limited to retrieving 31 days at a time.
The Keywords Tags option available in the rankings connectors will include the list of tags a keyword belongs to at the time of retrieval. Turning this option on will reduce maximum retrievable rows to less than 310,000. It’s recommended to turn on Keywords Tags only when needed for your reporting.
Using a tag-level connector on a subset of your keywords allows you to focus your reporting in Looker Studio and report on longer historical ranges. You can use existing tags or even make new tags, just for Looker Studio.
Limitations of the Looker Studio platform
- Looker Studio connectors are built using Google App Script (GAS), and we can use GAS’ caching functionality to cache data we receive from our API. However, it has a caching limit of 900 keys, where each key can store 100kb of data. This is roughly 80mb of data, which is partially why our connector can reach a maximum of 62 days with 5000 keywords. Any more than that, and we risk overloading the GAS cache.
- Looker Studio reports can have a maximum of 1 million rows of data in them. This means, for example, for a site with 250,000 tracked keywords on it, we can only get 4 days of historical ranking data on the keyword set – even if we try to pull all that data in a reasonable amount of time from our API endpoint.
- “Data blending” is when you blend two different Looker Studio connectors’ data together. You cannot blend two copies of the same Looker Studio connector to get around the 62 day limit for 5000 keywords. Unfortunately, the way Looker Studio does its data blending is limiting, so you cannot create two data sets from two of the same connector in any manageable way

